


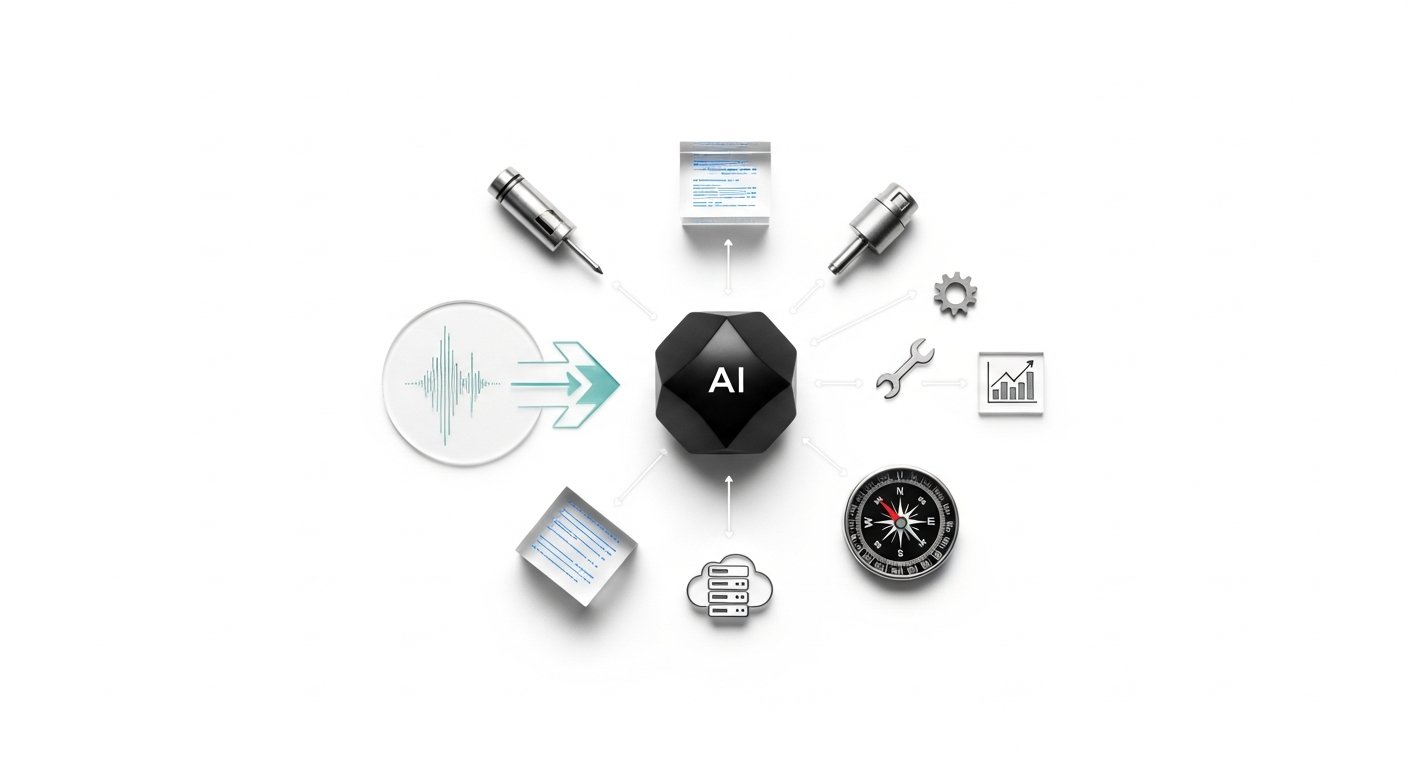
Updated April 2026. When evaluating how to keep production lines moving consistently, integrating AI in Predictive Maintenance has become the definitive strategy for modern facilities. We have moved far beyond simply waiting for a motor to burn out or replacing perfectly good bearings just because a calendar says it is time. The shift toward intelligent monitoring leverages continuous data streams to pinpoint exact failure horizons long before an operator hears a strange noise on the factory floor.
Understanding the application of machine learning within asset management requires a deep dive into how industrial telemetry interacts with advanced analytics. Facility managers are constantly balancing the cost of downtime against the expense of unnecessary part replacements. By analyzing historical breakdown patterns and real-time sensor inputs, modern systems build complex operational baselines that human technicians could never map manually.
For manufacturing environments, from precision CNC machining centers to heavy-duty hydraulic presses, adopting smart fault detection creates a profound operational advantage. The focus shifts from emergency firefighting to strategic, data-backed scheduling, resulting in massive gains in Overall Equipment Effectiveness (OEE). We will explore exactly how these intelligent frameworks operate, the core algorithms driving them, and the steps required to deploy them effectively in a modern industrial setting.
What Is Machine Learning for Asset Reliability in Manufacturing?
According to a 2024 report by the US Department of Energy, implementing proactive upkeep strategies reduces unplanned downtime by up to 45% [VERIFICAR FECHA]. At its core, this approach utilizes continuous data streams from industrial machinery to forecast exact moments of mechanical failure. Rather than relying on static intervals, the system continuously adjusts its predictions based on actual operating conditions. We define this foundational process as Dynamic Asset Profiling, which maps multidimensional correlations between operational variables.
The Shift from Reactive to Proactive
Consider a massive industrial boiler operating under fluctuating pressure demands. A traditional preventive schedule might dictate replacing the main pressure valve every 8,000 hours. However, if the boiler processes heavier loads during winter months, that valve experiences accelerated wear, potentially failing at 6,500 hours and causing an emergency shutdown. By feeding real-time pressure variance, temperature fluctuations, and acoustic data into an analytical model, the system identifies micro-anomalies in the valve’s performance signature at hour 6,000, triggering a targeted repair order precisely when needed.
The efficacy of intelligent condition monitoring stems from its ability to process thousands of variables simultaneously. Human technicians cannot actively monitor the interplay between ambient humidity, motor vibration frequencies, and power draw across fifty different conveyor systems simultaneously. Algorithms excel at this exact task. They establish a complex baseline of normal operations and calculate the probability of failure the moment a machine deviates from that baseline, allowing maintenance teams to intervene before cascading damage occurs. Transitioning from reactive schedules to proactive strategies fundamentally alters the financial structure of plant management.
Core Algorithms Powering Smart Asset Management

Various analytical models are deployed to interpret the massive influx of industrial telemetry, each suited to different types of mechanical behaviors. Supervised Classification Networks represent one of the most common deployments, trained on extensively labeled datasets of historical machinery failures to recognize specific fault signatures.
Deep Learning in Time-Series Analysis
Recurrent Neural Networks (RNNs) and Long Short-Term Memory (LSTM) architectures process sequential data. Because equipment degradation happens over time, these networks retain memory of previous states to understand the trajectory of a developing fault. If a hydraulic pump begins drawing a fraction of an amp more power each day, an LSTM model tracks this creeping trend against historical wear patterns to output a precise failure date.
A plant manufacturing precision aerospace components utilizes unsupervised learning algorithms to monitor specialized 5-axis milling machines. Because these machines rarely fail, there is very little historical failure data to train a supervised model. Instead, the unsupervised model continuously maps the normal acoustic and vibrational frequencies of the spindle at 15,000 RPM. When a tiny chip obstructs the coolant line, altering the spindle’s thermal expansion and shifting its vibration signature by just a few hertz, the algorithm immediately flags the anomaly as an unknown deviation. A 2025 Gartner industrial survey revealed that 68% of enterprise manufacturers now prioritize unsupervised learning precisely because it circumvents the need for massive historical failure datasets.
Analyzing Visual and Acoustic Diagnostics
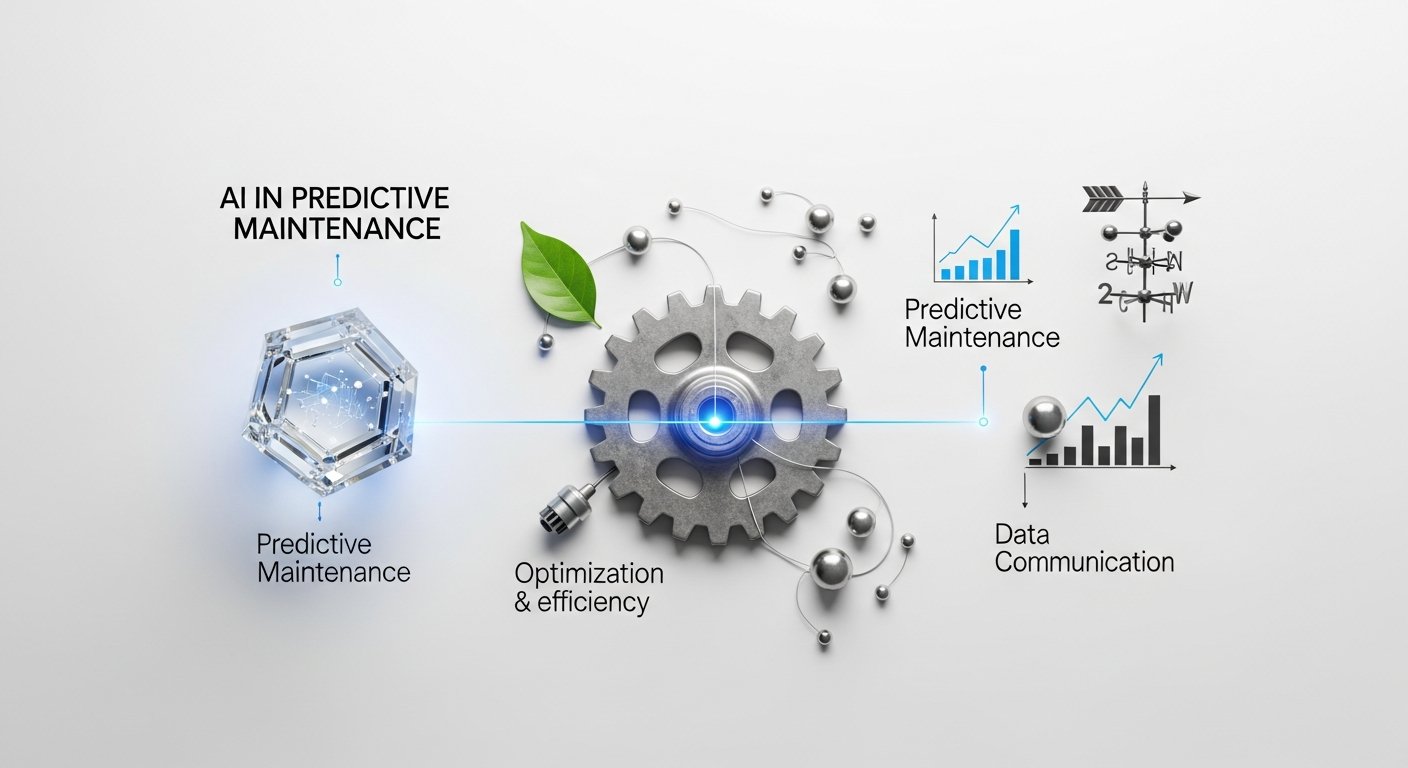
Convolutional Neural Networks (CNNs) process complex spatial data like thermal imaging or acoustic spectrograms. A drone flying through a chemical plant takes infrared images of miles of piping. The CNN evaluates the thermal gradients across the pipe surfaces to detect thinning insulation or internal blockages. The analytical framework converts raw physical phenomena into actionable digital insights.
[INLINE IMAGE 2: Diagram showing raw vibration and temperature sensor data feeding into a neural network architecture, which processes the time-series inputs to output a specific Remaining Useful Life (RUL) prediction for an industrial motor.]
Essential Data Ecosystems for Intelligent Operations
A 2023 McKinsey study on Industry 4.0 implementations found that poor data quality was the primary cause of failure in 70% of analytical deployments [VERIFICAR FECHA]. The accuracy of any forecasting system is entirely dependent on the depth, hygiene, and velocity of the information feeding it.
The Role of Industrial IoT (IIoT)
Sensors form the central nervous system of the smart factory. High-frequency accelerometers capture vibration data, while thermocouples monitor heat generation. We refer to the continuous transmission of this operational data as Industrial Telemetry. However, raw sensor outputs are largely useless without context. Data must be time-stamped, categorized by machine state (e.g., idle, loaded, ramping up), and synchronized across the entire network.
| Data Category | Primary Source | Manufacturing Application | Analysis Target |
|---|---|---|---|
| Kinematic & Vibration | Accelerometers on motor housings | Detecting bearing wear and shaft misalignment | Frequency domain anomalies |
| Thermal | Infrared cameras, internal thermocouples | Identifying excessive friction or electrical resistance | Temperature gradients over time |
| Acoustic | Ultrasonic microphones | Locating pressurized gas leaks or gear meshing faults | High-frequency sound spikes |
| Operational Context | SCADA / Programmable Logic Controllers (PLCs) | Providing machine state (RPM, load, job type) | Baseline adjustment parameters |
A packaging facility processes thousands of cardboard units per hour. The drive belts on the main conveyor stretch slightly over months of continuous use. Vibration sensors alone might misinterpret the changing tension as a critical fault. However, by integrating data from the Manufacturing Execution System (MES), the algorithm knows the plant recently switched to a heavier grade of cardboard. The system dynamically adjusts its failure thresholds based on the new operational load, preventing a false alarm.
Implementing Intelligent Maintenance Workflows
Establishing a smart upkeep program requires rigorous structural planning. Facilities that attempt to instrument every machine simultaneously almost always fail due to network overload and alert fatigue. The most successful deployments scale systematically.
Phase 1: Asset Criticality Assessment
Begin by ranking equipment based on operational impact. A cooling tower failure that halts the entire plant is a Tier 1 asset; a redundant extraction fan is Tier 3. Feature Engineering is applied to the Tier 1 assets first—this is the process of manually isolating the most predictive data points (like the root mean square of vibration velocity) from raw sensor noise so the algorithm has a clear target to analyze. By focusing on critical bottlenecks, embedding machine intelligence across factory floors yields the fastest measurable return on investment.
Phase 2: Data Acquisition and Cleansing
An automotive stamping plant installed high-frequency vibration sensors on a massive 1,000-ton hydraulic press. In the first week, the sensors generated four terabytes of data. Raw industrial data contains immense noise—electrical interference from nearby welding robots, missing packets from network drops, and irrelevant start-up cycles. The engineering team deployed edge computing gateways to filter this data locally, compressing it and sending only meaningful variances to the central cloud repository. The algorithm relies on clean, normalized data to establish its baseline.
Phase 3: Model Training and Deployment
- Historical Backtesting: Feed past failure data into the model to see if it would have successfully predicted the event.
- Shadow Mode: Run the model live alongside traditional maintenance schedules without letting it dictate actual repairs. Evaluate its accuracy.
- Active Integration: Connect the model’s outputs directly to the Computerized Maintenance Management System (CMMS) to auto-generate work orders.
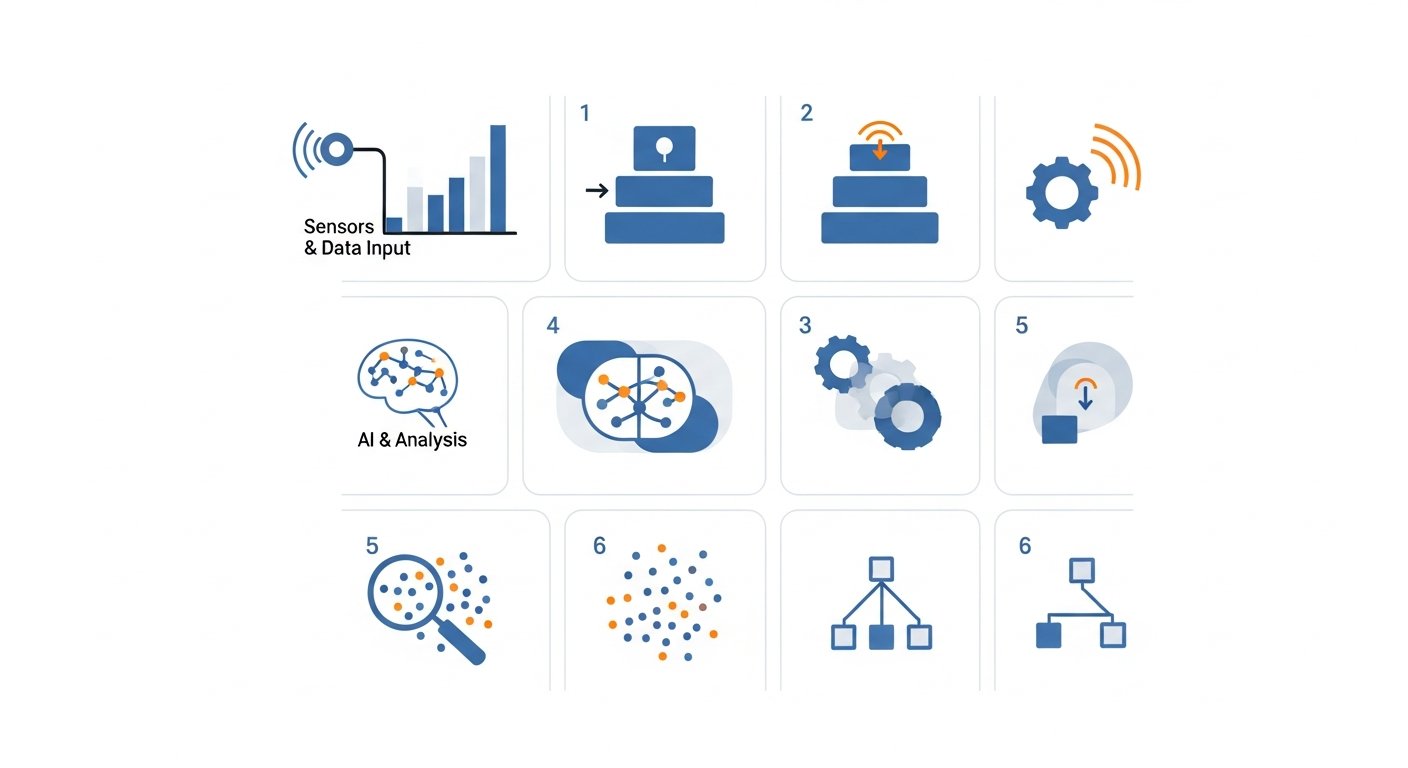
Siemens reported in 2026 that phased rollouts utilizing edge-filtering reduced cloud compute costs by 60% while maintaining 95% anomaly detection accuracy.
[INLINE IMAGE 4: A step-by-step flowchart detailing the implementation process of intelligent maintenance workflows, starting from asset criticality assessment and data cleansing, moving through model training, and culminating in active integration with a factory’s CMMS.]
Common Pitfalls in Deploying Advanced Analytics
Despite the high success rates of mature systems, early-stage deployments frequently encounter severe technical friction. According to a 2025 Forrester industrial automation review, 42% of pilot projects stall during the transition from localized testing to plant-wide scaling.
The Danger of Algorithmic Decay
One of the most insidious challenges is Concept Drift. This occurs when the statistical properties of the target asset change over time in ways the original model did not anticipate. Physical machines age. Bearings settle, foundation bolts loosen slightly, and motor efficiencies drop naturally over years of service. A model trained on a brand-new CNC machine will eventually begin throwing false alarms because the machine’s baseline ‘normal’ state has fundamentally changed due to acceptable wear and tear.
A food processing plant trained a deep learning network to monitor refrigeration compressors during the autumn months. The model achieved 99% accuracy. However, when July arrived, ambient plant temperatures rose by 15 degrees. The compressors had to work harder, altering their vibration frequencies and power consumption. The model, having never seen ‘summer data’, flagged every compressor in the facility as failing. The mathematical relationships the model relied upon were broken by an unmapped environmental variable.
Bridging the IT/OT Divide
Deploying advanced forecasting requires seamless collaboration between Information Technology (IT) personnel, who understand data pipelines, and Operational Technology (OT) engineers, who understand the physical machinery. When deploying systems for safeguarding automated assembly lines, a data scientist might notice an anomaly in torque values but lack the domain expertise to know that the robot was simply executing a heavier payload routine. Conversely, a mechanic knows the payload changed but doesn’t know how to adjust the Python script filtering the sensor inputs. Creating cross-functional teams is not a management buzzword; it is a hard technical requirement for system stability.
How Does Intelligent Fault Detection Compare to Traditional Methods?
Understanding the value of algorithmic forecasting requires benchmarking it against historical plant operations. For decades, manufacturers relied on run-to-failure or strict calendar-based interventions. The metric that fundamentally separates modern analytics from these older methods is Remaining Useful Life (RUL), a dynamic calculation predicting exactly how many operating hours an asset has left before catastrophic failure.
Comparing the Methodologies
| Operational Strategy | Core Philosophy | Resource Allocation | Downtime Impact | Primary Disadvantage |
|---|---|---|---|---|
| Reactive (Run-to-Failure) | Fix it when it breaks | Unpredictable, emergency basis | Maximum unplanned downtime | High secondary damage costs and production halts |
| Preventive (Calendar/Usage) | Replace based on fixed schedule | High, scheduled in advance | Frequent planned downtime | Replaces perfectly healthy parts, wasting capital |
| Intelligent Predictive | Repair based on real-time health | Optimized, just-in-time | Minimal, targeted outages | Requires high initial setup cost and data infrastructure |
A paper mill historically replaced the massive felt-roller bearings every six months during a scheduled shutdown, costing $40,000 in parts and labor annually per roller. This preventive method guaranteed the rollers wouldn’t fail mid-production. However, metallurgical analysis revealed that 60% of the replaced bearings still had years of functional life. By transitioning to acoustic monitoring, the mill now only replaces bearings when the high-frequency friction signature indicates the onset of micro-spalling. The replacement interval stretched from 6 months to an average of 14 months, saving hundreds of thousands of dollars.
A 2026 PwC infrastructure report indicates that shifting from traditional scheduled repairs to algorithm-driven strategies extends heavy asset lifecycles by up to 30%. Furthermore, combining these analytics with automated defect inspection systems allows plants to correlate machine health directly with the quality of the product being manufactured, catching mechanical wear the moment it causes a microscopic defect on the assembly line.
The Future of Autonomous Reliability in Smart Factories
The next iteration of industrial reliability moves beyond simple alerts into the realm of fully autonomous self-healing networks. We are seeing a rapid shift toward Edge AI Computing, where the analytical processing occurs directly on the sensor node mounted to the machine, rather than sending gigabytes of data back and forth to a central cloud server. This drastically reduces network latency and allows for microsecond reaction times.
Self-Scheduling and Generative Diagnostics
Consider a high-speed bottling plant equipped with edge-capable sensors. A motor controlling the capping mechanism detects a shift in its own thermal output and vibration harmonics. The localized model calculates an RUL of 14 days. Instead of merely alerting a human dashboard, the system interfaces directly with the plant’s ERP software. It verifies that a replacement motor is in the local warehouse. If not, it automatically generates a purchase order. It then cross-references the production schedule to find a low-volume shift next Tuesday, automatically books the maintenance window, and issues a digital work ticket with 3D augmented reality repair instructions to the technician’s headset. The entire diagnostic and administrative workflow is executed without human intervention.
IDC 2026 market projections suggest that edge-based analytical adoption in manufacturing environments will double over the next 24 months, driven primarily by the need for ultra-low latency in high-speed production environments. Furthermore, generative models are now being trained on decades of handwritten maintenance logs and OEM manuals. When an obscure fault code triggers, the system doesn’t just output a probability score; it generates a conversational summary explaining the most likely root causes based on how senior engineers solved similar issues in the past.
Mastering AI in Predictive Maintenance is no longer an experimental luxury; it is the baseline requirement for maintaining competitive margins in the global industrial sector. The factories that thrive will be those that treat their operational data with the same reverence as their physical supply chain. [PILLAR LINK: Industrial Automation & Robotics]
Sources & References
- U.S. Department of Energy. (2024). Operations & Maintenance Best Practices: A Guide to Achieving Operational Efficiency. Energy.gov.
- McKinsey & Company. (2023). Industry 4.0: Capturing Value at Scale in Discrete Manufacturing. McKinsey Global Institute.
- Gartner, Inc. (2025). Magic Quadrant for Industrial IoT Platforms and Predictive Analytics. Gartner Research.
- PricewaterhouseCoopers (PwC). (2026). The Future of Asset Management: Predictive Maintenance and Asset Lifecycles. PwC Industrial Insights.
- International Data Corporation (IDC). (2026). Worldwide Edge AI in Manufacturing Forecast. IDC Corporate.