


What is Root Cause Analysis and Why is it Critical in Manufacturing?
In the complex world of industrial production, challenges inevitably arise, from equipment malfunctions to product defects and operational inefficiencies. Merely addressing the symptoms of these issues provides only temporary relief. To achieve sustainable improvements, it is essential to delve deeper and uncover the fundamental reasons behind problems. This systematic process of identifying the fundamental, underlying causes of problems rather than just treating symptoms is precisely what effective root cause analysis in manufacturing entails. It is an indispensable tool for achieving sustainable improvements in quality, efficiency, and safety within industrial production environments, driving continuous improvement initiatives.
Manufacturing teams implement this systematic problem-solving methodology to identify underlying production defects, operational bottlenecks, safety incidents, or recurring equipment failures. By meticulously investigating and understanding the true origins of a problem, organizations can develop and implement targeted, long-lasting solutions, preventing recurrence and fostering a culture of proactive problem-solving. This foundational step is crucial for any enterprise committed to operational excellence and robust quality management.
The Core Principles of Effective Problem Identification in Production
At its heart, systematic problem identification in production relies on several key principles that guide its application:
- Focus on Underlying Causes: The primary goal is to move beyond superficial symptoms to discover the deepest cause(s) that, if removed, would prevent the problem from recurring.
- Systematic Approach: It’s not a haphazard guessing game but a structured, logical process that uses specific tools and methodologies to investigate incidents.
- Data-Driven Decision Making: Conclusions and proposed solutions must be based on verifiable evidence and data, not assumptions or speculation. This often involves collecting process data, sensor readings, and historical maintenance records.
- Preventive Action: The ultimate aim is not just to fix the past but to prevent future occurrences, thereby improving overall system reliability and performance.
- Team-Based Approach: Complex issues often require diverse perspectives. Cross-functional teams involving engineers, operators, quality personnel, and management are typically more effective.
Why Proactive Problem Resolution is Pivotal for Industrial Efficiency
The critical nature of proactive problem resolution in industrial settings cannot be overstated. Its direct impact on several key performance indicators makes it a cornerstone of modern manufacturing excellence:
- Enhanced Quality Control: By addressing the root causes of defects, manufacturers can significantly reduce scrap, rework, and customer returns, leading to higher product quality and stronger brand reputation.
- Improved Operational Efficiency: Identifying and eliminating the sources of downtime, bottlenecks, and inefficiencies leads to smoother production flows, increased throughput, and better utilization of resources.
- Cost Reduction: Preventing recurrence of problems avoids costs associated with repairs, warranty claims, lost production time, and waste disposal.
- Increased Safety: Investigating the fundamental reasons behind safety incidents helps implement robust preventive measures, protecting personnel and minimizing risks.
- Regulatory Compliance: Many industries have strict regulatory requirements that necessitate thorough investigation and documentation of incidents and corrective actions. Effective RCA helps meet these obligations.
- Customer Satisfaction and Trust: Consistent product quality and reliable delivery, born from effective problem resolution, build customer loyalty and market confidence.
Effective operational issue identification enhances industrial manufacturing by preventing recurring equipment failures, streamlining processes, and ensuring product integrity. It forms the backbone of any organization striving for sustained operational excellence.
Key Root Cause Analysis Methodologies for Industrial Settings
Understanding the various methodologies for industrial problem-solving is crucial for selecting the right tool to effectively diagnose and solve specific production challenges. No single method fits all situations; rather, the complexity of the issue, available data, and desired depth of analysis dictate the most appropriate technique. This section explores several widely used approaches, highlighting their strengths and applications within manufacturing.
[INLINE IMAGE 1: diagram showing a flowchart for selecting an RCA methodology based on problem complexity and data availability]
How Does the 5 Whys Method Apply to Production Issues?
The 5 Whys is a simple, iterative interrogative technique used to explore the cause-and-effect relationships underlying a particular problem. The core idea is to ask “Why?” five times (or more, if necessary) to peel back layers of symptoms and uncover the ultimate root cause. Its simplicity makes it highly effective for moderately complex issues that don’t involve intricate statistical analysis.
Application Example in Manufacturing:
Consider a scenario where a machine on an assembly line repeatedly breaks down, causing production delays.
- Problem: Assembly machine stopped operating, causing downtime.
- Why? The motor failed.
- Why? The motor overheated.
- Why? The bearing seized, increasing friction and heat.
- Why? The bearing lacked lubrication.
- Why? The preventive maintenance schedule for lubrication was consistently missed due to high production demands and a lack of dedicated personnel.
The root cause here isn’t the motor failure itself, but a systemic issue with maintenance scheduling and resource allocation. This simple technique quickly exposes the deeper operational flaw.
Leveraging Fishbone Diagrams for Manufacturing Defect Analysis
Also known as an Ishikawa diagram or cause-and-effect diagram, the Fishbone diagram is a visual brainstorming tool used to categorize the potential causes of a problem to identify its root causes. The “head” of the fish represents the problem statement, and the “bones” branch out to major categories of causes, often referred to as the 6 Ms: Man (People), Machine, Material, Method, Measurement, and Environment.
Application Example in Manufacturing:
Imagine a persistent issue with “High Product Defect Rate” for a specific component.
The Fishbone diagram would have “High Product Defect Rate” at its head. The major bones would then be:
- Man: Lack of operator training, fatigue, inadequate supervision, poor communication.
- Machine: Worn tooling, incorrect machine calibration, inadequate maintenance, sensor malfunction.
- Material: Substandard raw materials, inconsistent batch quality, incorrect material handling.
- Method: Outdated standard operating procedures (SOPs), incorrect setup process, inefficient workflow.
- Measurement: Calibration errors in inspection equipment, inconsistent inspection methods, subjective quality checks.
- Environment: Temperature fluctuations, humidity issues, dust contamination, poor lighting.
By visually mapping out these potential causes, teams can systematically investigate each branch to identify the most probable contributors to the defect rate.
Using Pareto Charts to Prioritize Manufacturing Problems
The Pareto chart, based on the Pareto Principle (or the 80/20 rule), is a bar graph that shows the frequency of problems in descending order, along with a cumulative percentage line. It helps prioritize issues by illustrating that a relatively small number of causes often account for the majority of effects. This is invaluable for manufacturing teams to focus their efforts where they will have the greatest impact.
Application Example in Manufacturing:
A production facility records various types of downtime events over a month.
A Pareto chart might reveal:
- Machine A breakdowns: 40% of total downtime
- Tooling changeovers: 25% of total downtime
- Material shortages: 15% of total downtime
- Operator error: 10% of total downtime
- Other minor issues: 10% of total downtime
The chart clearly indicates that addressing “Machine A breakdowns” and “Tooling changeovers” would resolve 65% of all downtime, making them the top priorities for problem-solving efforts.
Advanced Techniques: FTA and FMEA in High-Risk Manufacturing
For high-risk manufacturing environments, such as aerospace, automotive, or medical devices, more rigorous and quantitative techniques are often necessary.
Fault Tree Analysis (FTA)
FTA is a deductive, top-down failure analysis that uses Boolean logic to trace backward from an undesirable event (the “top event”) to all possible contributing basic events. It’s particularly useful for analyzing safety-critical systems or complex equipment failures.
Application Example in Manufacturing:
Analyzing the causes of a “Catastrophic Equipment Failure” in a chemical reactor. The top event would be the failure, and the tree would branch down through intermediate events (e.g., “Pressure Exceeds Limit,” “Cooling System Failure”) linked by AND/OR gates to basic events (e.g., “Sensor Malfunction,” “Valve Stuck Closed,” “Power Outage”). This allows for the calculation of system reliability and identification of single points of failure.
Failure Mode and Effects Analysis (FMEA)
FMEA is a proactive, bottom-up approach used to identify potential failure modes in a process or design, assess their severity, occurrence, and detection, and prioritize actions to mitigate risks. It’s often used during the design phase of a new product or process, but also for existing systems.
Application Example in Manufacturing:
Analyzing potential failure modes in a new automated assembly line for electric vehicle batteries.
For each step in the assembly, potential failure modes are identified (e.g., “Incorrect torque applied to bolt”), along with their potential effects (e.g., “Battery pack rattles,” “Safety hazard”). A Risk Priority Number (RPN) is calculated by multiplying Severity (S), Occurrence (O), and Detection (D) ratings (each 1-10). High RPNs indicate critical areas requiring immediate design changes or control measures.
| Methodology | Primary Use Case | Key Steps/Characteristics | Pros in Manufacturing | Cons/Limitations | Example Manufacturing Application |
|---|---|---|---|---|---|
| 5 Whys | Simple, moderately complex problems, quick analysis. | Iterative “Why?” questions, explores cause-and-effect. | Easy to learn and apply, requires minimal data, good for immediate operational issues. | Can be superficial for complex issues, relies on subjective judgments, may not uncover systemic issues without facilitator expertise. | Investigating repetitive minor machine jams or operator errors. |
| Fishbone Diagram (Ishikawa) | Brainstorming potential causes, visual organization of complex issues. | Categorizes causes (6 Ms), visual representation, team collaboration. | Comprehensive overview, promotes brainstorming, excellent for team problem-solving sessions. | Can become cluttered, doesn’t prioritize causes, doesn’t quantify relationships. | Analyzing causes of a consistent product cosmetic defect or high waste rate. |
| Pareto Chart | Prioritizing problems, identifying high-impact areas. | Bar graph with cumulative percentage, 80/20 rule. | Clear visualization of priorities, data-driven focus, directs resources effectively. | Only identifies “what” problems are most frequent, not “why” they occur; requires good data collection. | Prioritizing types of customer complaints, machine downtimes, or safety incidents. |
| Fault Tree Analysis (FTA) | Analyzing safety-critical systems, complex equipment failures, deductive reasoning. | Top-down approach, uses Boolean logic gates, calculates failure probabilities. | Systematic and rigorous, quantifies risks, effective for complex system reliability. | Can be time-consuming and complex to construct, requires specialized knowledge, static analysis. | Assessing the failure probability of a critical safety interlock system on a robotic cell. |
| Failure Mode and Effects Analysis (FMEA) | Proactive risk assessment, design/process improvement, identifying potential failures. | Identifies failure modes, effects, causes; rates Severity, Occurrence, Detection; calculates RPN. | Proactive risk reduction, improves design robustness, prioritizes actions based on risk. | Can be resource-intensive, requires expert input, RPN can be subjective if not standardized. | Evaluating potential failure points in a new manufacturing process for medical devices. |
Step-by-Step Implementation of RCA in Manufacturing Operations
Successful application of a systematic problem prevention strategy in manufacturing operations requires more than just choosing the right methodology; it demands a structured, disciplined approach. Following a clear sequence of steps ensures thoroughness, accuracy, and effective resolution. This section outlines a comprehensive, typical process for identifying and addressing the root causes of issues in an industrial environment.
The 7-Step Problem-Solving Process for Industrial Operations
While specific approaches may vary, a generally accepted framework for effective problem-solving involves these steps:
-
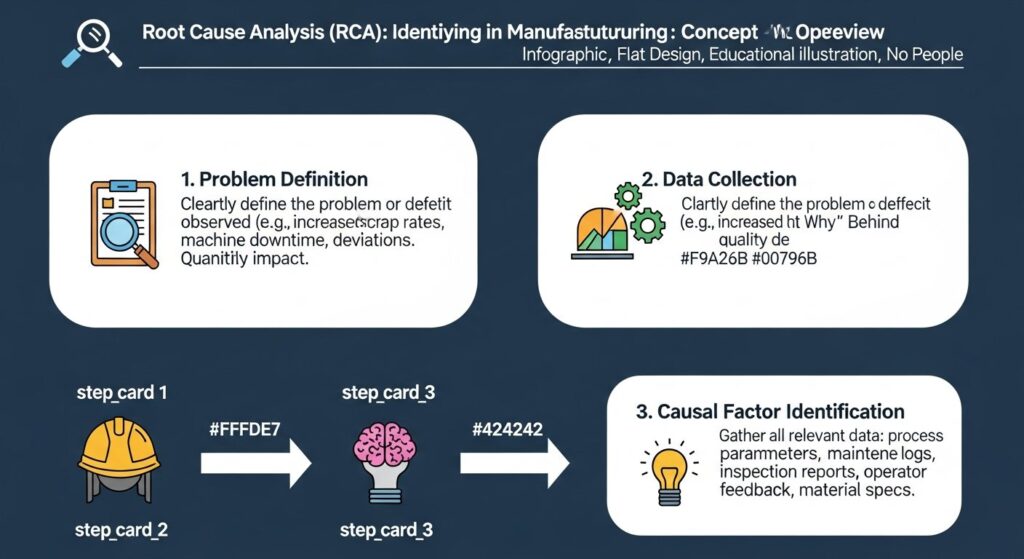
Define the Problem:
- Clearly and concisely articulate the problem. Use SMART criteria (Specific, Measurable, Achievable, Relevant, Time-bound).
- Quantify the problem’s impact (e.g., “Scrap rate for Product X increased by 5% in Q3 2026,” “Machine Z experiences 3 hours of unscheduled downtime per week”).
- Establish a problem statement that focuses on the effect, not the presumed cause.
- Form a cross-functional team with relevant expertise.
-
Gather Data:
- Collect all pertinent information related to the problem. This is often the most critical and time-consuming step.
- Sources include:
- SCADA (Supervisory Control and Data Acquisition) systems: Real-time process parameters, alarm histories.
- MES (Manufacturing Execution Systems): Production records, batch data, quality checks.
- IoT and Sensor Data: Temperature, pressure, vibration, current, vision system outputs.
- Maintenance Logs: Repair histories, part replacements, service schedules.
- Quality Control Reports: Defect rates, inspection results, customer complaints.
- Operator Interviews: First-hand accounts, observations, procedural adherence.
- Environmental Monitoring: Humidity, dust, temperature.
- Distinguish facts from opinions. Visualize data using charts and graphs.
-
Identify Possible Causal Factors:
- Brainstorm all potential factors that could contribute to the problem. At this stage, judgment is suspended; all ideas are considered.
- Utilize methodologies like Fishbone diagrams to categorize and organize these potential causes (Man, Machine, Material, Method, Measurement, Environment).
- Consider both direct (proximate) and indirect causes.
-
Determine the Root Cause(s):
- Apply specific problem identification tools (e.g., 5 Whys, FTA, FMEA) to systematically analyze the possible causal factors.
- Use the gathered data to test hypotheses and validate potential causes. Eliminate factors that are not supported by evidence.
- Continue drilling down until the fundamental, underlying cause(s) are identified. This is often where a systemic issue rather than an individual event is uncovered.
- Confirm that the identified root cause, if removed, would truly prevent the problem’s recurrence.
-
Develop and Evaluate Solutions:
- Brainstorm a range of potential solutions for each identified root cause.
- Evaluate each solution based on feasibility, cost, effectiveness, safety, and potential side effects.
- Prioritize solutions, focusing on those that offer the most impact with acceptable risk and resource investment.
- Consider short-term containment actions while long-term permanent solutions are developed.
-
Implement Solutions:
- Develop an action plan with clear responsibilities, timelines, and required resources.
- Pilot the solution if possible to test its effectiveness and identify any unforeseen issues before full-scale deployment.
- Execute the approved changes, ensuring proper training and communication to affected personnel.
-
Verify Effectiveness and Standardize:
- Monitor the process and collect data to verify that the implemented solution has eliminated or significantly reduced the problem.
- If the solution is effective, update relevant documentation (SOPs, work instructions, maintenance schedules) to standardize the new process.
- Share lessons learned across the organization to prevent similar issues elsewhere.
- Establish ongoing monitoring to ensure the problem does not recur.
What are the Benefits of Effective RCA for Manufacturing Quality and Lean Initiatives?
Once underlying causes are identified and solutions implemented, the tangible benefits for manufacturing become clear, extending across various facets of operational performance. Effective application of advanced troubleshooting in industrial settings is not merely a reactive measure; it’s a strategic investment that yields significant returns in quality, efficiency, cost reduction, and continuous improvement. It serves as a vital enabler for achieving key objectives within quality management and Lean manufacturing frameworks.
Quantifiable Impact on Operational Excellence
The impact of robust problem resolution can be measured across several key performance indicators:
- Reduced Scrap and Rework: By eliminating the root causes of defects, manufacturers can see quantifiable reductions, e.g., a “15% reduction in scrap rate” for a specific product line, leading to significant material and labor cost savings.
- Improved Overall Equipment Effectiveness (OEE): Addressing underlying causes of breakdowns, minor stoppages, and performance losses directly contributes to higher OEE. For instance, a “20% increase in machine uptime” translates directly to increased production capacity.
- Enhanced Product Quality and Reliability: Consistently producing higher quality products minimizes customer returns, warranty claims, and improves brand reputation. This can lead to increased market share and customer loyalty.
- Lower Operating Costs: Beyond scrap and rework, effective problem resolution reduces maintenance costs (fewer unexpected repairs), energy waste, and overall operational expenditures.
- Increased Safety Performance: Thoroughly investigating safety incidents, near-misses, or recurring ergonomic issues can lead to a “10% decrease in safety incidents” or a significant reduction in lost-time injuries, creating a safer work environment.
- Streamlined Production Flow: Identifying and eliminating bottlenecks and inefficiencies improves process flow, reducing lead times and increasing throughput. This is a core tenet of Lean manufacturing.
- Boosted Employee Morale: Empowering employees to identify and solve problems, rather than just dealing with recurring frustrations, increases engagement, job satisfaction, and a sense of ownership.
- Stronger Data-Driven Culture: The systematic collection and analysis of data inherent in effective problem resolution fosters a data-driven decision-making culture, moving away from anecdotal problem-solving.
These benefits collectively contribute to a more competitive, resilient, and profitable manufacturing enterprise, aligning perfectly with the goals of Lean principles like waste reduction and continuous flow, and quality standards like ISO 9001.
Overcoming Challenges in RCA Implementation within Manufacturing
While the advantages are significant, organizations often face specific challenges when applying systematic problem prevention in industrial settings. Recognizing these hurdles and developing strategies to overcome them is crucial for successful integration and sustained benefits. Effective implementation requires more than just technical know-how; it demands cultural shifts, dedicated resources, and strong leadership.
Common Mistakes in Manufacturing Problem Resolution
Understanding common pitfalls helps in proactively avoiding them:
- Treating Symptoms, Not Causes: This is the most prevalent mistake. Rushing to a quick fix without proper investigation leads to recurring problems and wasted resources.
- Lack of Data: Relying on assumptions, intuition, or insufficient data makes it impossible to accurately identify and verify root causes.
- Blame Culture: If employees fear reprisal for reporting problems or making mistakes, critical information will be withheld, hindering effective analysis.
- Insufficient Resources or Time: Conducting thorough investigations requires dedicated time, trained personnel, and sometimes specialized equipment or software. When these are lacking, efforts are often superficial.
- Poor Team Composition: Not involving the right cross-functional personnel (operators, engineers, maintenance, quality) limits perspectives and can lead to incomplete solutions or resistance to change.
- Lack of Follow-Through: Identifying a root cause and even a solution is useless if the solution isn’t implemented effectively, monitored, and standardized.
- Over-Complicating Simple Issues: Applying overly complex methods to straightforward problems can be wasteful and discourage adoption.
- Underestimating Human Factors: Overlooking human error as a symptom of a larger system or process design flaw rather than an isolated cause.
Strategies for Successful Implementation
To navigate these challenges and ensure effective advanced troubleshooting, manufacturers can adopt several best practices:
- Foster a Culture of Continuous Improvement: Promote psychological safety where problem reporting is encouraged, and learning from mistakes is valued over assigning blame.
- Invest in Training: Equip employees at all levels with the knowledge and skills in various problem identification methodologies.
- Allocate Dedicated Resources: Ensure that teams have the necessary time, budget, and tools (software, testing equipment) to conduct thorough investigations.
- Establish Clear Processes: Define standardized procedures for launching and conducting problem-solving efforts, including roles, responsibilities, and decision-making authority.
- Leverage Technology: Implement data collection systems (SCADA, MES, IoT sensors), statistical analysis software, and quality management systems to provide objective evidence.
- Promote Cross-Functional Collaboration: Actively involve diverse teams in the problem-solving process to gain a holistic understanding and foster buy-in for solutions.
- Leadership Engagement: Senior management must champion problem-solving initiatives, provide visible support, and hold teams accountable for implementing and verifying solutions.
- Prioritize Problems: Use tools like Pareto charts to focus efforts on the highest impact problems first, demonstrating quick wins and building momentum.
[INLINE IMAGE 2: infographic illustrating common RCA challenges and their corresponding solutions in a manufacturing context]
Integrating RCA with Lean and Six Sigma in Manufacturing
Within the broader Quality, Lean & Process Improvement cluster, the techniques of advanced troubleshooting serve as a foundational element, significantly amplifying the effectiveness of methodologies like Lean Manufacturing and Six Sigma. These powerful frameworks are not isolated; rather, their synergistic application can drive unparalleled operational excellence and waste reduction within industrial processes.
Supporting Lean Manufacturing Principles
Lean manufacturing focuses on eliminating waste (Muda) and maximizing customer value through continuous flow. Effective problem identification directly supports several Lean principles:
- Eliminating Waste: By uncovering the causes of defects (DPMO), overproduction, waiting times, excess inventory, unnecessary motion, over-processing, and transportation, problem identification directly attacks the seven forms of waste. For example, identifying the reason for excessive machine setups (over-processing) can lead to solutions like SMED (Single-Minute Exchange of Die).
- Just-In-Time (JIT): RCA helps maintain smooth production flow by resolving issues that could disrupt JIT delivery, such as equipment breakdowns or quality deviations.
- Jidoka (Autonomation): Identifying why a machine repeatedly stops itself due to an abnormality (Jidoka principle) leads to permanent fixes, preventing defects from passing downstream.
- Standardized Work: When a problem’s root cause is identified and a solution implemented, the updated process becomes the new standard, reinforcing standardized work practices.
- Continuous Improvement (Kaizen): Problem identification is the engine of Kaizen. Each solved problem, no matter how small, contributes to the ongoing cycle of improvement.
Enhancing Six Sigma Methodologies
Six Sigma is a data-driven approach focused on reducing variation and defects to near perfection (3.4 defects per million opportunities). Systematic problem prevention is integral to its core DMAIC (Define, Measure, Analyze, Improve, Control) methodology:
- Define: Problem identification helps clearly define the problem (Y) and its scope for a Six Sigma project.
- Measure: Data collected during the “Measure” phase provides the empirical evidence necessary for problem identification. Statistical process control (SPC) data can pinpoint when and where deviations occur.
- Analyze: This is where the core of problem identification resides. Tools like Fishbone diagrams, 5 Whys, FTA, and FMEA are extensively used to identify the critical X’s (root causes) affecting the Y (problem). Statistical analysis (regression, ANOVA) further validates these causes.
- Improve: Solutions developed from identified root causes are implemented during the “Improve” phase.
- Control: Once solutions are implemented and verified, problem identification findings are used to establish control plans and ongoing monitoring systems to prevent recurrence, ensuring sustained gains.
By integrating these approaches, manufacturers can move beyond isolated problem-solving to a holistic system of continuous improvement, where every identified issue becomes an opportunity to strengthen the overall process.
Advanced Tools and Software for Manufacturing RCA
The effectiveness of industrial problem identification can be significantly enhanced by leveraging modern technology and specialized software. These tools automate data collection, provide sophisticated analytical capabilities, and streamline the problem-solving workflow, leading to faster, more accurate, and more comprehensive investigations.
Digital Enablers for Enhanced Problem Resolution
Modern manufacturing utilizes a range of digital tools to support and elevate advanced troubleshooting:
- Quality Management Software (QMS): Integrated QMS platforms often include modules for non-conformance management, corrective and preventive actions (CAPA), and dedicated problem identification workflows. They centralize data, automate tracking, and ensure compliance with standards like ISO 9001.
- Enterprise Asset Management (EAM) / Computerized Maintenance Management Systems (CMMS): These systems track asset performance, maintenance schedules, repair histories, and component failures. Their data is invaluable for analyzing equipment-related root causes, especially for FTA and FMEA.
- Statistical Analysis Software (e.g., Minitab, JMP, R, Python): For Six Sigma and complex statistical problem identification, these tools are essential. They allow for hypothesis testing, regression analysis, ANOVA, control charts, and design of experiments (DoE) to quantify relationships between variables and validate root causes.
- Data Historians and SCADA/MES Systems: These systems collect vast amounts of real-time operational data (temperature, pressure, speed, flow, energy consumption) from production lines. This granular data provides the objective evidence needed to pinpoint deviations and trigger events.
- IoT and Sensor Data Analytics Platforms: The proliferation of IoT sensors on machines provides continuous streams of data on vibration, acoustics, thermal signatures, and electrical currents. AI-powered analytics can detect anomalies, predict failures (predictive maintenance), and even suggest potential root causes by correlating various sensor inputs.
- Visualization Tools (e.g., Tableau, Power BI): These platforms help create interactive dashboards and visualizations that make complex data understandable, facilitating the identification of trends, patterns, and outliers crucial for any problem-solving effort.
- Dedicated Problem-Solving Software: Some software solutions specifically guide users through various problem identification methodologies (e.g., Ishikawa diagram builders, FMEA calculators, 5 Whys templates) and document the process.
- Digital Twin Technology: Creating virtual models of physical assets or processes allows manufacturers to simulate various scenarios, test hypotheses about failure modes, and predict the impact of proposed solutions before implementing them in the real world.
By embracing these advanced tools, manufacturing organizations can move beyond manual, time-consuming investigations to a proactive, predictive, and highly efficient approach to problem prevention, ensuring continuous operational improvement.
Sources & References
- ASQ. (2026). Root Cause Analysis: A Comprehensive Guide. Retrieved from [Insert relevant ASQ URL, e.g., https://asq.org/quality-resources/root-cause-analysis]
- Ishikawa, K. (1985). What Is Total Quality Control? The Japanese Way. Prentice-Hall. (Referenced for Fishbone diagrams)
- Kaplan, S., & Garrick, B. J. (1981). On the Quantitative Definition of Risk. Risk Analysis: An International Journal, 1(1), 11-27. (Referenced for Fault Tree Analysis principles)
- Stamatis, D. H. (2003). Failure Mode and Effect Analysis: FMEA from Theory to Execution (2nd ed.). ASQ Quality Press. (Referenced for FMEA)
- Ohno, T. (1988). Toyota Production System: Beyond Large-Scale Production. Productivity Press. (Referenced for 5 Whys and Lean principles)
Reviewed by Marcus Thorne, Senior Technical Editor — Last reviewed: March 30, 2026
For more detailed insights into optimizing your production processes and ensuring robust quality, explore our comprehensive resources on Quality Management Systems in Manufacturing, Lean Manufacturing Principles, and Process Improvement Strategies.