
Mastering Quality: A Guide to Statistical Process Control (SPC) in Manufacturing
At Mitsubishi Manufacturing, our commitment to excellence is deeply embedded in every process, from design to delivery. We understand that achieving unparalleled quality demands more than just final product checks; it requires a deep understanding and rigorous control of the underlying processes that create those products. This comprehensive guide will demystify Statistical Process Control, exploring its foundational principles, essential tools, practical implementation steps, and the profound benefits it offers. By embracing SPC, manufacturers can gain unprecedented insight into their operations, anticipate potential problems before they occur, and consistently deliver products that meet the highest standards of quality and performance, ultimately driving efficiency and securing a competitive edge.
By John Doe, Quality Engineer at Mitsubishi Manufacturing
What is Statistical Process Control (SPC)? Defining the Foundation of Quality
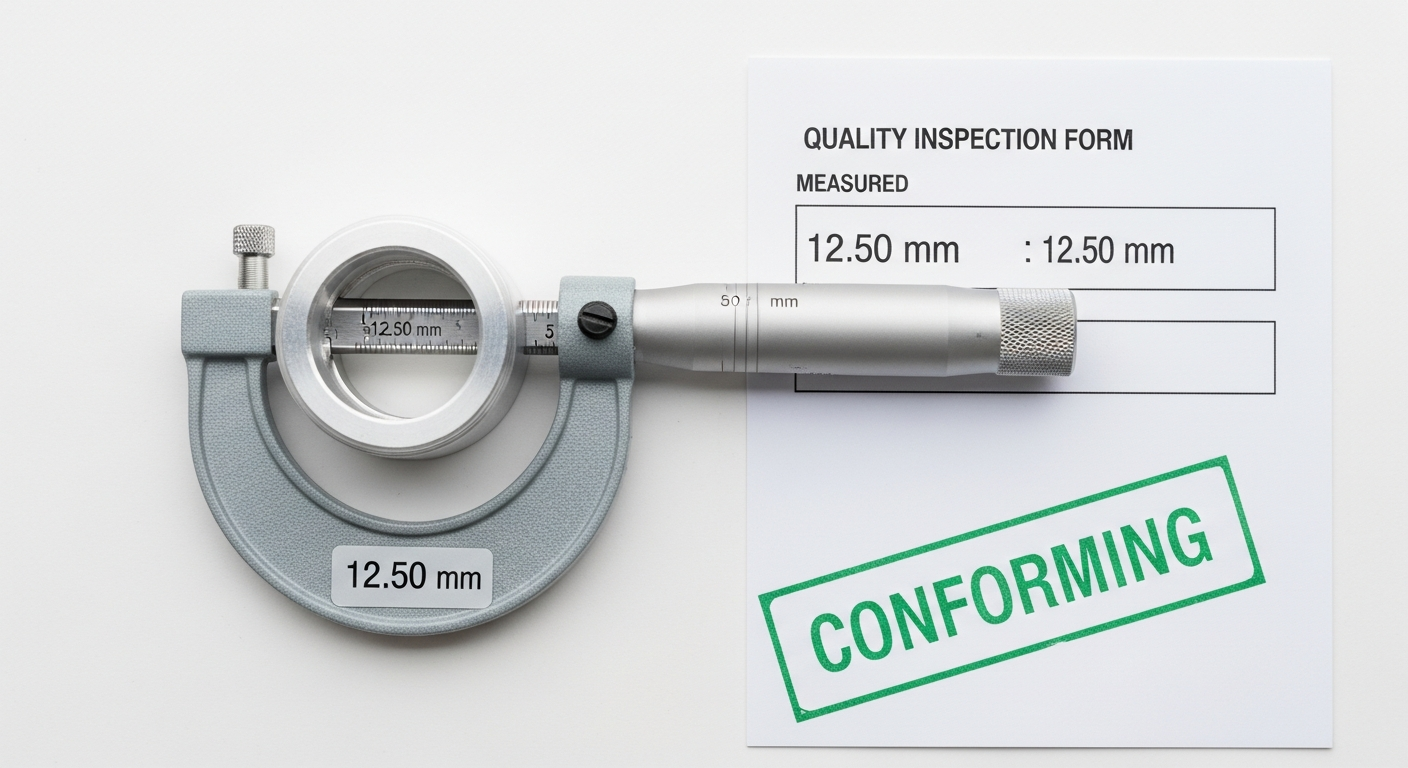
Statistical Process Control (SPC) is a data-driven methodology that employs statistical methods to monitor, control, and improve a process. Its primary goal is to ensure that a process operates efficiently, producing more conforming product with reduced waste and rework. Unlike traditional quality inspection, which often involves checking products after they’ve been made, SPC focuses on the process itself, aiming to prevent defects from occurring in the first place.
The core concept behind SPC is understanding process variation. No two products are ever exactly identical; there will always be some degree of variation. SPC helps differentiate between two types of variation:
- Common Cause Variation (or Random Cause Variation): This is the inherent, natural, and expected variation within a stable process. It’s the “noise” in the system, due to many small, unidentifiable causes that are always present. For example, slight variations in raw material density or minor fluctuations in machine temperature within normal operating parameters. A process operating with only common cause variation is considered “in statistical control” or “stable.”
- Special Cause Variation (or Assignable Cause Variation): This is an unnatural, unpredictable, and usually large variation that arises from specific, identifiable sources. Examples include a machine malfunction, an untrained operator, a defective batch of raw material, or an abrupt change in environmental conditions. Special causes indicate that a process is “out of statistical control” and needs immediate investigation and corrective action.
The power of SPC lies in its ability to visually distinguish these two types of variation through tools like control charts. By understanding and managing variation, manufacturers can achieve predictable and consistent quality. This shift from a reactive “inspect and correct” mindset to a proactive “prevent and optimize” approach is what makes statistical process control (SPC) in manufacturing an indispensable tool for achieving operational excellence and fostering a culture of continuous improvement.
Practical Tip: To effectively implement SPC, begin by clearly defining the critical quality characteristics of your product or process. These are the measurable attributes (e.g., dimensions, weight, purity, cycle time) that directly impact product performance and customer satisfaction. Without a clear understanding of what needs to be controlled, your SPC efforts will lack focus and impact.
The Core Principles and Benefits of Implementing SPC in Manufacturing
Implementing Statistical Process Control isn’t merely about deploying a set of tools; it’s about embedding a philosophy of continuous improvement and data-driven decision-making within an organization. The principles underpinning SPC are powerful drivers of operational excellence, yielding a multitude of tangible benefits for manufacturers.
Core Principles:
- Proactive Prevention: Rather than waiting for defects to occur and then correcting them, SPC enables manufacturers to monitor processes in real-time, detecting deviations before they lead to non-conforming products. This shift from detection to prevention is foundational.
- Data-Driven Decision Making: SPC provides objective, statistical evidence about process behavior. This allows decisions to be based on facts and data, eliminating guesswork and emotional responses.
- Focus on Process, Not Just Product: SPC emphasizes that product quality is a direct result of process quality. By understanding and controlling the inputs and steps of a process, output quality naturally improves.
- Empowerment and Engagement: When operators are trained to understand and use SPC charts, they gain a deeper insight into their own work. This fosters a sense of ownership and responsibility for process performance and quality.
- Continuous Improvement: SPC isn’t a one-time fix but a continuous cycle. Identifying and eliminating special causes, and then reducing common cause variation, drives an ongoing journey of process refinement and optimization.
Key Benefits of Implementing SPC:
- Reduced Waste and Rework: By identifying and addressing process issues early, SPC significantly minimizes scrap, rework, and the need for costly inspections, leading to substantial material and labor savings. A leading automotive component manufacturer, for instance, reported a 30% reduction in rework for a critical engine part within a year of implementing SPC for its machining operations.
- Improved Product Consistency and Quality: SPC ensures that products consistently meet specifications, enhancing reliability and performance. This directly translates to higher customer satisfaction and fewer warranty claims.
- Increased Efficiency and Throughput: Stable, in-control processes run more predictably and with fewer interruptions, maximizing production efficiency and output. Downtime related to quality issues can decrease dramatically.
- Enhanced Customer Satisfaction and Loyalty: Delivering consistently high-quality products builds trust and strengthens customer relationships, leading to repeat business and positive brand reputation.
- Better Decision Making: With clear statistical insights into process behavior, management can make informed decisions regarding capital investments, process changes, and resource allocation.
- Cost Savings: The sum of all these benefits—less waste, rework, inspections, and warranty claims—translates directly into significant cost reductions and improved profitability. Some companies report ROI on SPC implementations within months.
- Support for Regulatory Compliance: In highly regulated industries like automotive, aerospace, and medical devices, SPC provides robust documentation and evidence of process control, aiding in compliance with industry standards (e.g., ISO/TS 16949, AS9100).
The strategic implementation of statistical process control (SPC) in manufacturing is therefore not just a quality initiative; it is a business imperative that drives operational excellence, enhances competitiveness, and builds a resilient, quality-focused organization.
Practical Tip: When presenting SPC benefits to leadership or teams, quantify the potential impact. Translate reductions in defects, rework, or scrap into direct cost savings or increased production capacity to demonstrate the clear business value.
Key Tools and Methodologies: The SPC Toolkit
To effectively implement SPC, manufacturers rely on a suite of statistical tools designed to collect, analyze, and interpret process data. While various tools contribute, the control chart remains the cornerstone of SPC.
1. Control Charts: The Heart of SPC
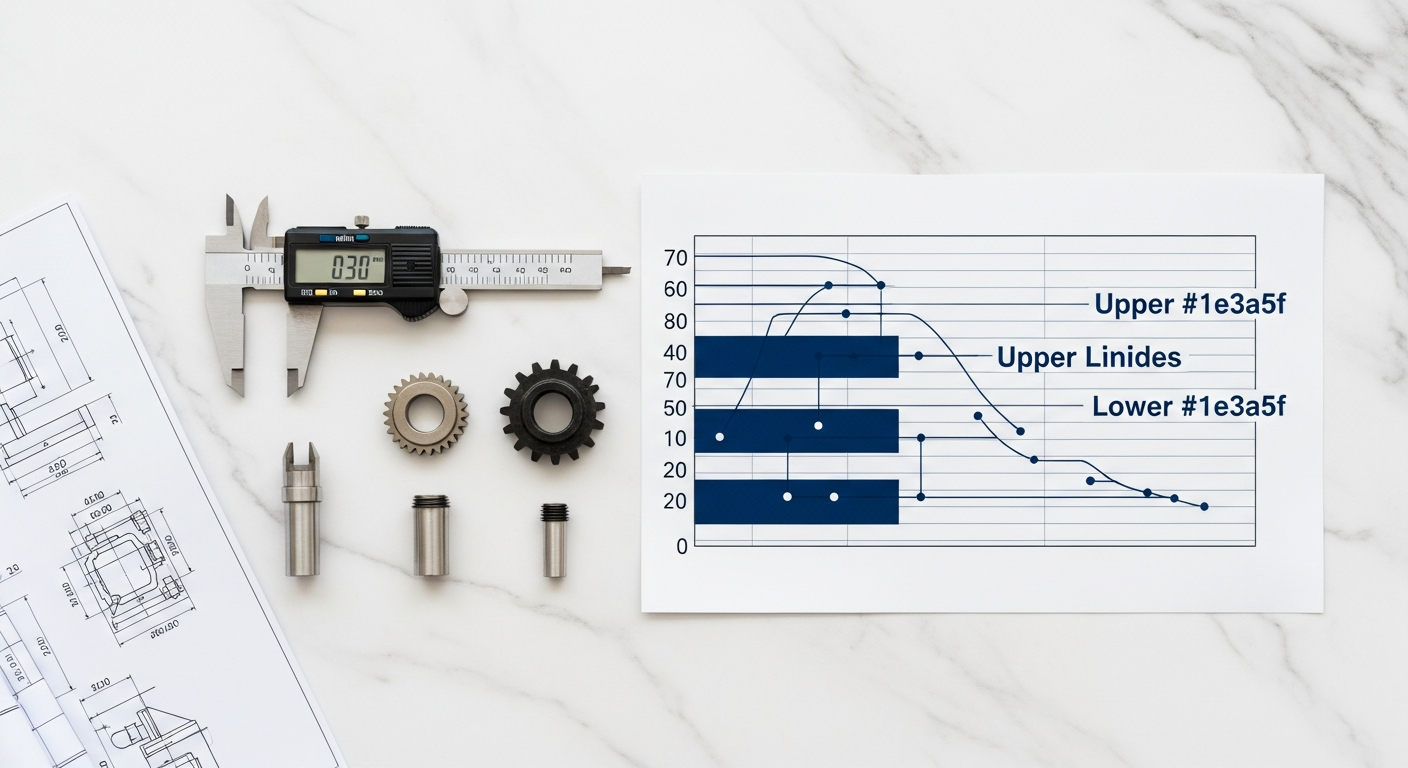
Control charts are graphical representations that show how a process changes over time. Data is plotted in time order, with a central line representing the process average, and upper and lower control limits (UCL and LCL) that define the expected range of common cause variation. By observing data points relative to these limits, operators can quickly identify whether a process is stable (in control) or experiencing special cause variation (out of control).
There are several types of control charts, chosen based on the type of data being collected:
-
For Variable Data (measurements that can be on a continuous scale):
- X-bar and R Charts: Most common for continuous data. The X-bar chart monitors the process average, while the R chart monitors the process range (variability). Both are typically used in tandem. For example, monitoring the diameter of a machined part.
- X-bar and S Charts: Similar to X-bar and R, but the S chart (standard deviation) is more appropriate for larger subgroup sizes (typically n > 10).
- Individual (X) and Moving Range (MR) Charts: Used when it’s difficult or impractical to form subgroups (e.g., when data is collected infrequently or from automated processes). Monitors individual measurements and the range between successive measurements.
-
For Attribute Data (counts of defects or defectives):
- P Chart: Monitors the proportion of defective items in a sample. Useful when classifying items as “good” or “bad.” For example, the percentage of scratched panels in a batch.
- NP Chart: Similar to the P chart, but monitors the actual number of defective items instead of the proportion.
- C Chart: Monitors the number of defects (nonconformities) per unit when the number of inspection opportunities is constant. For example, the number of blemishes on a painted surface of a fixed size.
- U Chart: Monitors the number of defects per unit when the number of inspection opportunities varies between samples. For example, the number of errors found per printed circuit board, where boards may vary in complexity.
Interpreting Control Charts: A process is considered out of statistical control if:
- Any data point falls outside the control limits.
- There is a “run” of several consecutive points all above or below the center line (e.g., 7 points in a row).
- There is a clear trend (e.g., 6 points in a row steadily increasing or decreasing).
- Other non-random patterns are observed (e.g., cyclical patterns, hugging the control limits or the center line).
When an out-of-control signal is detected, it indicates the presence of a special cause, requiring immediate investigation and corrective action to restore process stability.
2. Other Complementary SPC Tools:
- Histograms: Graphical representation of the distribution of a set of data. They show the frequency of different values, helping to visualize the shape, spread, and central tendency of process output.
- Pareto Charts: A type of bar chart that shows the frequency of problems or causes in descending order of occurrence. Based on the Pareto Principle (80/20 rule), it helps identify the “vital few” problems that are responsible for the “trivial many” effects, guiding prioritization of improvement efforts.
- Cause-and-Effect Diagrams (Fishbone or Ishikawa Diagrams): A visual tool used to explore and identify all possible causes of a specific problem or effect. It categorizes potential causes into main branches (e.g., Man, Machine, Material, Method, Measurement, Environment).
- Check Sheets: Simple, structured forms used to collect and organize data in a systematic way. They simplify data collection for analysis, especially for attribute data.
- Scatter Diagrams: Used to explore the relationship between two variables. They plot pairs of numerical data, with one variable on each axis, to detect if a correlation exists.
By leveraging this comprehensive toolkit, manufacturers can gain deep insights into their processes, move beyond mere data collection to actionable intelligence, and sustain high levels of quality performance. For Mitsubishi Manufacturing, the precise application of these tools ensures our products consistently meet world-class standards.
Practical Tip: When selecting a control chart, always consider the type of data (variable or attribute) and how the data is naturally subgrouped. Misuse of charts can lead to incorrect conclusions and wasted effort. If in doubt, consult an SPC expert or refer to established quality guidelines.
Implementing SPC: A Step-by-Step Guide for Manufacturers
Successful implementation of statistical process control (SPC) in manufacturing requires a systematic approach, strong commitment, and careful execution. This guide outlines the essential steps to integrate SPC effectively into your operations.
Step 1: Define the Process and Critical Characteristics
Begin by clearly identifying the specific process or process step you want to control. Then, determine the critical quality characteristics (CTQs – Critical To Quality) that directly impact product function, safety, or customer satisfaction. These characteristics must be measurable. For example, in an automotive assembly line, critical characteristics might include torque settings for fasteners, dimensions of welded components, or coating thickness.
Step 2: Establish Data Collection Methods
Design a robust system for collecting data. This involves:
- Defining Subgroups: Determine how data will be grouped (e.g., 5 consecutive parts from a machine every hour).
- Sampling Frequency: Decide how often samples will be taken (e.g., hourly, shift-based).
- Measurement System Analysis (MSA): Ensure your measurement system (gauges, instruments, operators) is accurate, precise, and capable of detecting relevant variation. A poor measurement system will render SPC ineffective. Conduct gauge R&R (Repeatability and Reproducibility) studies.
- Data Sheets: Create clear, easy-to-use data collection forms, either manual or electronic.
Step 3: Select the Appropriate Control Chart
Based on whether your data is variable (continuous measurements like length, temperature) or attribute (counts of defects or defectives), choose the correct control chart type (e.g., X-bar and R, P, C, U). Refer to the SPC Toolkit section for guidance.
Step 4: Collect and Plot Initial Data
Step 5: Calculate Control Limits
Once sufficient baseline data is collected, calculate the center line (process average) and the upper and lower control limits (UCL and LCL) for your control chart. These limits are derived directly from your process data, not from engineering specifications. Statistical software packages can automate this calculation, but understanding the underlying formulas is beneficial.
Step 6: Analyze the Control Chart and Establish Control
Review the initial control chart for any out-of-control signals (points outside limits, runs, trends). If special causes are present, investigate their root cause using tools like cause-and-effect diagrams. Eliminate the special cause, remove the associated data points from the initial calculation if they were truly anomalous, and recalculate control limits until the process appears to be in statistical control. This stable process, free of special causes, forms the reliable baseline for future monitoring.
Step 7: Monitor and Maintain
Once the process is deemed in statistical control, continue to collect and plot data in real-time. Operators should be trained to observe the charts, identify out-of-control signals, and understand their responsibility to notify supervisors or engineers when a special cause is indicated. This continuous monitoring helps maintain process stability.
Step 8: Respond to Out-of-Control Signals and Implement Corrective Action
When an out-of-control signal appears, stop the process (if feasible and safe), investigate the root cause immediately, and implement corrective actions to eliminate the special cause. Document all investigations and actions taken. The goal is to prevent the recurrence of the special cause.
Step 9: Review and Improve Process Capability
After a process has been operating in statistical control for a period, calculate its process capability (Cp and Cpk). This indicates whether the stable process is actually capable of meeting customer specifications. If capability is low, focus efforts on reducing common cause variation through process improvement projects (e.g., Lean, Six Sigma initiatives) to shift the process mean or reduce its inherent spread. This might involve equipment upgrades, material changes, or fundamental process redesign.
Practical Tip: Training is paramount. Ensure all relevant personnel—operators, supervisors, quality engineers—are thoroughly trained not just on how to read charts, but on the underlying statistical principles, how to respond to signals, and the importance of data integrity. Without proper training and understanding, SPC can be seen as a burden rather than a powerful tool.
Real-World Applications and Case Studies from the Manufacturing Floor
The versatility of statistical process control (SPC) in manufacturing makes it applicable across virtually every industry, from highly precise automotive components to high-volume consumer goods. Here are a few illustrative examples demonstrating its real-world impact:
Automotive Industry: Ensuring Precision in Engine Component Manufacturing
In the automotive sector, where precision and reliability are paramount, SPC is indispensable. Consider the manufacturing of an engine crankshaft. Critical dimensions, such as the diameter of main bearing journals or the concentricity of the crankpins, must be held within extremely tight tolerances. A deviation here can lead to excessive wear, vibration, or even catastrophic engine failure.
- Application: An automotive plant might use X-bar and R charts to monitor the diameter of a crankshaft journal after a grinding operation. Subgroups of 5 shafts are measured every hour.
- Scenario: For months, the process was stable. One day, the X-bar chart shows a point suddenly below the lower control limit, and the R chart shows a slight increase in range.
- Investigation & Result: The production team immediately investigates. They discover that a new batch of grinding wheels, supposedly identical, had a slightly different abrasive composition, causing the grinder to remove material too aggressively and inconsistently. By identifying this special cause (defective material batch), they isolate the problematic wheels, adjust grinding parameters, and return the process to control. This proactive detection prevented thousands of non-conforming crankshafts from being produced, saving an estimated $250,000 in scrap and rework costs over a quarter. Without SPC, these defects might only have been caught during final engine assembly or, worse, by the end customer.
Electronics Manufacturing: Optimizing Solder Paste Deposition
In electronics, the precise application of solder paste onto circuit boards is critical for reliable connections. Too much or too little paste, or misalignment, can lead to short circuits or open circuits.
- Application: A printed circuit board (PCB) manufacturer uses Individual and Moving Range (I-MR) charts to monitor the volume of solder paste deposited for a critical component pad. Automated vision systems measure paste volume on a sample of boards after each print cycle.
- Scenario: The I-MR chart shows a gradual upward trend in solder paste volume over several shifts, even though it’s still within control limits. While not “out-of-control” yet, the trend suggests a drift.
- Investigation & Result: The engineering team recognizes this “run” as an early warning. They investigate and find that the stencil wiper blade is showing signs of wear, leading to inefficient cleaning and a gradual buildup of paste on the stencil, increasing deposition volume. Replacing the worn wiper blade and adjusting print parameters prevents the process from going out of specification, averting potential rework on hundreds of thousands of PCBs and maintaining a first-pass yield of over 99.5%. This demonstrates SPC’s ability to predict and prevent future problems based on subtle shifts.
Food and Beverage Industry: Ensuring Accurate Fill Weights
For packaged food and beverages, accurate fill weight is crucial for both regulatory compliance and cost control. Underfilling leads to consumer complaints and regulatory fines, while overfilling means giving away product.
- Application: A beverage company uses X-bar and R charts to monitor the fill volume of bottles on a high-speed line. Subgroups of 4 bottles are randomly selected and weighed every 30 minutes.
- Scenario: The R chart suddenly shows a point above the upper control limit, indicating increased variability in fill weights, even though the X-bar chart (average fill) remains stable.
- Investigation & Result: Operators immediately check the filling nozzles and associated mechanisms. They discover a slight blockage in one of the multi-head filler nozzles. Clearing the blockage brings the R chart back into control. This quick detection prevents an entire shift’s production from having unacceptable variation in fill volumes. By consistently maintaining process control through SPC, the company was able to reduce average overfill by 1.5%, saving an estimated $1.2 million annually in product giveaway while remaining fully compliant with regulatory standards.
These examples highlight how SPC transforms raw data into actionable insights, enabling manufacturers to proactively address issues, optimize processes, and consistently deliver high-quality products. For Mitsubishi Manufacturing, leveraging SPC in these ways is fundamental to our operational excellence and our promise of reliability to our customers.
Practical Tip: When presenting SPC results or advocating for its implementation, use specific, quantifiable examples of savings or improvements. This helps stakeholders understand the direct business impact, reinforcing the value proposition of process control.
Overcoming Challenges and Ensuring Long-Term SPC Success
While the benefits of SPC are profound, its successful and sustainable implementation isn’t without challenges. Addressing these proactively is key to transforming SPC from a mere tool into a cornerstone of a robust quality management system.
Common Challenges in SPC Implementation:
- Lack of Leadership Buy-in and Support: Without clear endorsement and resource allocation from senior management, SPC initiatives can flounder. Leadership must understand the long-term strategic value beyond immediate cost savings.
- Inadequate Training and Understanding: If operators, supervisors, and engineers don’t understand the “why” and “how” of SPC, they may resist its adoption, misinterpret charts, or fail to act appropriately on signals.
- Poor Data Integrity and Collection: “Garbage in, garbage out” applies emphatically to SPC. Inaccurate measurements, inconsistent sampling, or incorrect data entry will lead to misleading control charts and flawed decisions.
- Resistance to Change: Employees accustomed to traditional “inspect and fix” methods may be reluctant to embrace a proactive, data-driven approach, fearing increased scrutiny or responsibility.
- Misinterpretation of Control Charts: Mistaking common cause variation for special cause variation (or vice-versa) can lead to tampering with a stable process (over-adjustment) or ignoring real problems.
- Lack of Root Cause Analysis Capability: Identifying an out-of-control signal is only the first step. If the team lacks the skills or tools to conduct thorough root cause analysis and implement effective corrective actions, the problem will recur.
- Insufficient Integration with Other Systems: SPC can operate in a silo if not integrated with other quality management systems (e.g., CAPA – Corrective and Preventive Action), ERP, or MES (Manufacturing Execution Systems).
- Maintaining Momentum: Initial enthusiasm for SPC can wane. Without continuous reinforcement and visible success stories, the initiative may lose priority over time.
Strategies for Ensuring Long-Term SPC Success:
- Secure Strong Leadership Commitment: Educate leaders on the strategic advantages and ROI of SPC. Integrate SPC metrics into broader organizational goals and performance reviews.
- Invest Heavily in Training: Provide comprehensive, role-specific training for all personnel involved. Operators need to understand how to collect data and interpret charts; supervisors need to know how to respond to signals and facilitate problem-solving; engineers need to be skilled in process capability analysis and advanced statistical techniques.
- Implement Robust Data Management Systems: Utilize automated data collection systems where possible to reduce human error and increase efficiency. Ensure proper calibration and maintenance of all measurement equipment through a strong Measurement System Analysis program.
- Foster a Culture of Continuous Improvement: Position SPC as a tool for improvement, not just control or blame. Celebrate successes, encourage employee suggestions, and promote a learning environment where issues are seen as opportunities for growth.
- Standardize Procedures: Document clear standard operating procedures (SOPs) for data collection, chart plotting, control limit recalculation, and response protocols for out-of-control signals.
- Integrate SPC into the Quality Management System: Link SPC findings directly to your Corrective and Preventive Action (CAPA) process. Use SPC data to drive Kaizen events or Six Sigma projects aimed at reducing common cause variation.
- Regular Review and Audit: Periodically review the effectiveness of your SPC charts, the relevance of monitored characteristics, and the accuracy of control limits. Audit adherence to SPC procedures.
- Leverage Technology: Modern SPC software can automate data collection, chart generation, and even alert generation, freeing up personnel to focus on analysis and problem-solving.
By proactively addressing these challenges and implementing these strategies, manufacturers can establish a robust and sustainable SPC program. At Mitsubishi Manufacturing, our dedication to these principles ensures that SPC is not just a technique but an integral part of our commitment to delivering superior quality products consistently.
Practical Tip: When an out-of-control condition is detected, resist the urge to immediately adjust the process settings. First, ensure the signal is valid (not a data entry error or measurement issue). Then, investigate the root cause thoroughly before implementing any corrective action. Adjusting a stable process in response to common cause variation (“tampering”) will only increase variability, making the problem worse.
Conclusion: The Mitsubishi Advantage Through Proactive Quality Management
In an era defined by relentless innovation and ever-increasing customer expectations, the pursuit of exceptional quality is no longer a differentiator—it is a prerequisite for sustained success. Statistical Process Control (SPC) stands as a foundational pillar in this pursuit, offering manufacturers a scientifically proven methodology to transition from reactive problem-solving to proactive prevention and continuous improvement.
This guide has illuminated how statistical process control (SPC) in manufacturing provides the essential framework for understanding and managing process variation. By employing tools like control charts, manufacturers gain real-time visibility into their operations, enabling them to detect special causes before they lead to defects and to systematically reduce common cause variation for greater efficiency and consistency. The benefits are clear and quantifiable: reduced waste, lower costs, improved product quality, enhanced customer satisfaction, and a stronger competitive position.
At Mitsubishi Manufacturing, our long-standing legacy of engineering excellence is intrinsically linked to our rigorous application of quality management principles, with SPC at its core. We understand that true quality is built into every step of the manufacturing process, not merely inspected at the end. By empowering our teams with data-driven insights and fostering a culture of continuous vigilance, we ensure that every product bearing the Mitsubishi name meets the highest standards of reliability, performance, and durability.
Embracing SPC is more than just adopting a quality tool; it’s an investment in the future of your manufacturing operations. It empowers your workforce, optimizes your processes, and ultimately, safeguards your reputation and profitability. For any manufacturer striving for peak performance and unwavering quality, the journey to mastering SPC is not an option—it is the definitive path to achieving lasting excellence.
Take the Next Step: Ready to elevate your manufacturing quality and operational efficiency? Explore how integrating robust SPC practices can transform your production floor. Contact Mitsubishi Manufacturing to learn more about our commitment to quality and how advanced process control can benefit your organization.
Here are answers to common questions about Statistical Process Control:
Frequently Asked Questions