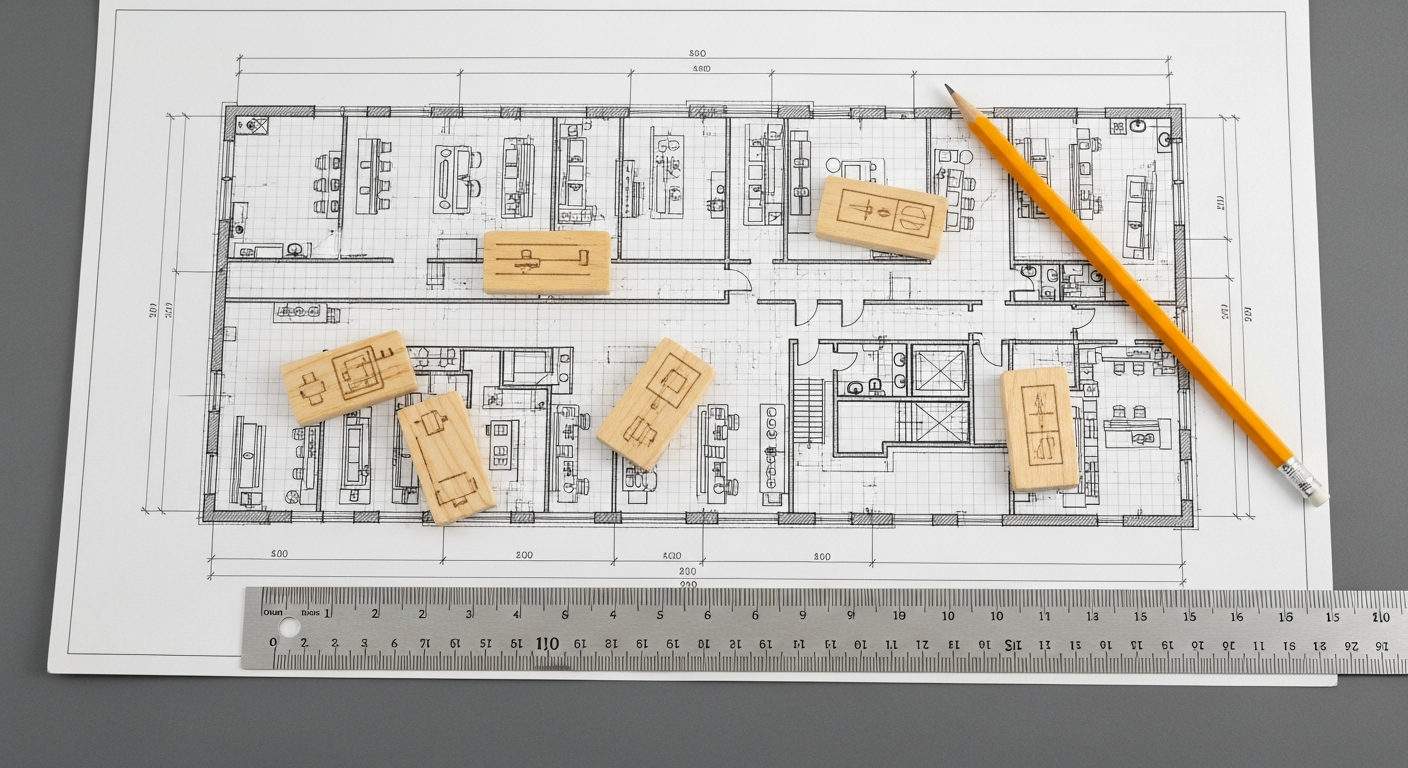
Cost of Poor Quality Calculation and Reduction Programs
TL;DR: The Cost of Poor Quality (CoPQ) is a significant, often hidden, financial burden on manufacturers, encompassing internal/external failures, appraisal, and prevention costs. Implementing systematic CoPQ calculation and targeted reduction programs is crucial for enhancing profitability, operational efficiency, and long-term competitiveness in the manufacturing sector.
Understanding the True Cost of Poor Quality (CoPQ)
The Cost of Poor Quality (CoPQ) is a critical metric that quantifies the financial impact of defects, errors, and inefficiencies within a manufacturing process. It’s often visualized as an iceberg, with visible costs like scrap and rework at the surface, and far larger, hidden costs such as lost customer loyalty, reputation damage, and delayed market entry lurking beneath. To effectively manage and reduce CoPQ, it’s essential to break it down into its core components, typically categorized using the Prevention-Appraisal-Failure (PAF) model:
- Prevention Costs: These are investments made to prevent defects from occurring in the first place. While often seen as an expenditure, prevention costs are arguably the most valuable, as they aim to eliminate the root causes of poor quality. Examples in manufacturing include robust design for manufacturability (DfM) and design for quality (DfQ) initiatives, comprehensive employee training programs on quality standards and procedures, process capability studies, statistical process control (SPC) implementation, quality planning, supplier quality assurance activities, and preventive maintenance on critical machinery. Investing more in prevention typically leads to significant reductions in appraisal and failure costs.
- Appraisal Costs: These are the costs associated with evaluating products, processes, and services to ensure they conform to quality standards. Appraisal activities are designed to detect defects before they reach the customer. Common manufacturing examples include incoming material inspection, in-process inspections, final product testing, calibration of equipment, quality audits, and maintaining laboratory facilities for quality checks. While necessary, excessive appraisal costs can indicate a reliance on detection rather than prevention, suggesting underlying process issues.
- Internal Failure Costs: These costs arise from defects discovered before the product is shipped to the customer. They represent inefficiencies and waste within the production system. Examples include the cost of scrap (materials, labor, overhead for discarded parts), rework (time, labor, materials to fix defective items), re-inspection and re-testing after rework, downtime due to quality issues, material review board activities, and yield losses. These costs directly impact a manufacturer’s bottom line by consuming resources without adding value.
- External Failure Costs: These are the most damaging and often the most difficult to quantify, as they occur when a defective product reaches the customer. They can severely impact brand reputation and customer loyalty. Manufacturing examples include warranty claims, product returns, customer complaints handling, field service and repair costs, product recalls, liability claims, legal expenses, and, critically, lost sales and market share due to damaged reputation. The long-term impact of external failures, particularly on brand perception, can far outweigh the immediate financial costs.
Understanding these categories provides a structured approach to identifying where quality-related costs are accumulating. For a manufacturing operation, recognizing that a significant portion of its operational budget is silently consumed by rework, scrap, warranty claims, or excessive inspection highlights the urgency of implementing effective CoPQ calculation and reduction programs. It’s not just about compliance; it’s about competitive advantage, sustainable growth, and delivering consistent value to customers.
Methodologies for CoPQ Calculation

Accurately calculating the Cost of Poor Quality (CoPQ) is the foundational step towards its effective reduction. Without a clear financial picture, improvement efforts can be misdirected or lack the necessary justification for investment. Several methodologies can be employed, with the choice often depending on the organization’s data availability, resources, and specific objectives. The most widely adopted approach is based on the PAF (Prevention, Appraisal, Failure) model, which we discussed previously. Here’s a deeper dive into practical calculation methodologies:
1. The PAF Cost Model (Detailed Application): This model, while conceptual in its categories, requires a systematic approach to data collection and attribution.
- Identification of Cost Drivers: Begin by brainstorming all activities, resources, and events that fall into each of the four CoPQ categories (Prevention, Appraisal, Internal Failure, External Failure). For instance, under Internal Failure, think about specific scrap types, rework stations, or reject bins.
- Data Collection: This is often the most challenging but crucial step. Data sources can include:
- Financial Records: General ledger accounts for quality department salaries, inspection equipment, warranty reserves, legal fees.
- Manufacturing Execution Systems (MES): Real-time data on scrap rates, rework hours, machine downtime, first-pass yield, material consumption.
- Enterprise Resource Planning (ERP) Systems: Procurement costs for raw materials (especially for scrap valuation), labor costs, inventory adjustments due to quality issues.
- Quality Management Systems (QMS): Non-conformance reports, corrective and preventive action (CAPA) logs, audit results, customer complaint data.
- HR Records: Training costs, salaries for quality personnel.
- Customer Service Records: Returns, warranty claims, field service reports.
- Cost Attribution: Assign monetary values to each identified cost driver. This often requires working with finance departments to determine hourly labor rates, material costs, overhead allocation, and depreciation of quality-related assets. For intangible costs like lost customer goodwill, estimations based on market research or historical data might be necessary, though these are often categorized as “opportunity costs” outside the direct PAF model.
- Aggregation and Reporting: Sum up all costs within each PAF category. Present the data clearly, perhaps as a percentage of sales, manufacturing costs, or total operating expenses. This provides a baseline for tracking improvements.
2. Process Cost Model: This approach focuses on mapping out specific processes and identifying the costs associated with deviations from the ideal process. It involves:
- Process Mapping: Documenting each step of a manufacturing process.
- Identifying Non-Value-Added Steps: Pinpointing activities that exist solely because of poor quality (e.g., rework loops, extra inspections).
- Costing Non-Conformances: Calculating the cost of these non-value-added steps and the resources consumed by them. This model is particularly effective for lean manufacturing environments.
3. Opportunity Cost Model: While not a direct calculation of existing CoPQ, this model considers the financial benefits lost due to poor quality. This includes lost sales from damaged reputation, missed market opportunities due to delayed product launches from quality issues, or the potential profit from products that were scrapped instead of sold. This model is more strategic and helps justify larger investments in quality improvement.
Regardless of the model, establishing a cross-functional team involving finance, operations, quality, and engineering is crucial for accurate data collection and interpretation. Regular calculation, perhaps quarterly or annually, allows manufacturers to monitor trends, assess the impact of reduction programs, and maintain quality as a strategic business imperative.
Establishing Effective CoPQ Reduction Programs
Calculating the Cost of Poor Quality (CoPQ) is merely the first step; the real value comes from implementing targeted reduction programs that transform identified losses into tangible gains. Effective CoPQ reduction is not a one-time project but an ongoing commitment to continuous improvement, deeply integrated into the manufacturing ethos. Several established frameworks and practical strategies can guide these efforts:
1. Lean Manufacturing Principles: Lean focuses on identifying and eliminating waste (Muda) in all its forms, and poor quality is a significant source of waste.
- Value Stream Mapping: Visually mapping the entire production process to identify non-value-added steps, bottlenecks, and areas where defects are generated or detected.
- Just-in-Time (JIT): Reducing inventory levels to expose quality problems quickly, preventing large batches of defective products.
- Poka-Yoke (Mistake-Proofing): Designing processes and tooling to prevent errors from occurring or to make them immediately obvious, thereby directly reducing internal failure costs.
- Kaizen (Continuous Improvement): Fostering a culture where all employees are empowered to identify and implement small, incremental improvements daily.
2. Six Sigma Methodology: A data-driven approach aimed at reducing process variation and eliminating defects to achieve near-perfect quality (3.4 defects per million opportunities).
- DMAIC (Define, Measure, Analyze, Improve, Control) Cycle: This structured problem-solving methodology is ideal for complex quality issues.
- Define: Clearly state the problem (e.g., high scrap rate on Line 3).
- Measure: Collect data to quantify the problem’s extent and impact (e.g., current scrap percentage, associated CoPQ).
- Analyze: Use statistical tools (e.g., Pareto charts, fishbone diagrams, regression analysis) to identify root causes.
- Improve: Develop and implement solutions to address root causes (e.g., process adjustments, equipment upgrades, training).
- Control: Implement measures to sustain improvements (e.g., SPC charts, standard operating procedures, regular audits).
- Design for Six Sigma (DFSS): Applied during product or process design to ensure quality is built in from the outset, preventing future CoPQ.
3. Total Quality Management (TQM): A management approach focused on long-term success through customer satisfaction, involving all members of an organization in improving processes, products, services, and the culture in which they work. TQM emphasizes:
- Customer Focus: Understanding and meeting customer requirements to reduce external failure costs.
- Employee Involvement: Empowering employees at all levels to contribute to quality improvement.
- Process-Centered Approach: Managing and improving processes rather than just inspecting outputs.
- Integrated System: Quality integrated into all aspects of the business, from design to delivery.
Practical Reduction Strategies:
- Root Cause Analysis (RCA): Utilize tools like the 5 Whys, Fishbone diagrams (Ishikawa), and FMEA (Failure Mode and Effects Analysis) to identify the fundamental reasons for defects, rather than just treating symptoms.
- Corrective and Preventive Actions (CAPA): Implement systematic processes to address identified non-conformances (corrective) and prevent their recurrence (preventive).
- Supplier Quality Management: Work closely with suppliers to ensure the quality of incoming materials, reducing defects at the earliest stage. This includes supplier audits, quality agreements, and performance monitoring.
- Process Standardization and Automation: Develop clear Standard Operating Procedures (SOPs) and automate repetitive tasks to reduce human error and ensure consistency.
- Employee Training and Empowerment: Equip employees with the skills and knowledge to perform their jobs correctly and empower them to stop production if quality issues arise (Jidoka).
- Design for Quality (DfQ): Integrate quality considerations early in the product design phase, making products inherently easier to manufacture correctly and less prone to defects.
Effective CoPQ reduction programs require leadership commitment, cross-functional collaboration, and a data-driven approach to prioritize and implement improvements. By systematically addressing the root causes of poor quality, manufacturers can significantly enhance profitability, boost customer satisfaction, and strengthen their market position.
Leveraging Technology for Quality Management and CoPQ Reduction

In the era of Industry 4.0, advanced technologies are transforming quality management, providing unprecedented capabilities for precise CoPQ calculation and highly effective reduction programs. Manufacturers are no longer limited to reactive quality control; instead, they can deploy proactive, predictive, and even prescriptive strategies to prevent defects and optimize processes. Leveraging these technological advancements is crucial for any organization committed to minimizing the Cost of Poor Quality.
1. Quality Management Systems (QMS) Software: Modern QMS platforms are central hubs for all quality-related data and processes. They digitize and automate critical functions, including:
- Document Control: Ensuring all employees have access to the latest SOPs, work instructions, and specifications, reducing errors due to outdated information.
- Non-Conformance Management: Streamlining the reporting, tracking, and resolution of defects and deviations, facilitating root cause analysis and CAPA implementation.
- Audit Management: Automating audit scheduling, checklist management, and finding tracking, improving compliance and identifying systemic issues.
- Supplier Quality Management: Managing supplier certifications, performance, and incoming material inspections, thereby preventing external defects from entering the production line.
- Training Management: Tracking employee training and certifications, ensuring workforce competency in quality procedures.
By centralizing quality data, QMS software provides a single source of truth, making CoPQ data collection significantly more efficient and reliable.
2. Manufacturing Execution Systems (MES) and Enterprise Resource Planning (ERP): These integrated systems provide the operational and financial backbone for CoPQ calculation and reduction.
- MES: Offers real-time visibility into production processes. It can track scrap rates, rework times, machine downtime due to quality issues, first-pass yield, and resource consumption at a granular level. This data is invaluable for accurately quantifying internal failure costs and identifying specific process bottlenecks.
- ERP: Manages financial data, inventory, procurement, and customer orders. It provides the monetary values for materials, labor, and overheads, essential for attributing costs to quality incidents. ERP also tracks warranty claims, returns, and customer service costs, contributing to external failure cost calculations.
The seamless integration between MES and ERP allows for a holistic view of quality costs across the entire value chain.
3. Data Analytics, Artificial Intelligence (AI), and Machine Learning (ML): These advanced capabilities transform raw data into actionable insights for CoPQ reduction.
- Predictive Quality: AI/ML algorithms can analyze historical production data, sensor readings, and environmental factors to predict potential defects before they occur. This allows for proactive adjustments to processes or maintenance, shifting costs from failure to prevention.
- Anomaly Detection: ML models can identify subtle deviations in process parameters that indicate impending quality issues, enabling early intervention.
- Root Cause Identification: AI can analyze vast datasets to pinpoint correlations and root causes of defects far more efficiently than manual methods.
- Process Optimization: AI can simulate different production scenarios to optimize parameters for maximum quality and efficiency, directly reducing CoPQ.
4. Industrial Internet of Things (IIoT) and Sensors: IIoT devices embedded throughout the manufacturing floor collect real-time data on machine performance, environmental conditions, and product characteristics.
- Real-time Monitoring: Sensors can detect deviations in temperature, pressure, vibration, or dimensional tolerances instantly, triggering alerts and enabling immediate corrective action.
- Traceability: IIoT enables end-to-end traceability of components and products, critical for managing recalls and identifying the source of defects.
- Preventive Maintenance: Monitoring equipment health can predict failures, allowing for maintenance before defects are produced, reducing internal failure costs.
5. Automation and Robotics: While not directly a data collection tool, automation significantly impacts CoPQ by reducing human error, increasing precision, and ensuring consistency in repetitive tasks. Collaborative robots (cobots) can perform tasks with high repeatability, minimizing variations that lead to defects. This shifts cost from internal failures towards prevention (initial investment in automation and programming).
By strategically implementing and integrating these technologies, manufacturers can build a robust quality ecosystem that not only accurately measures CoPQ but also actively prevents its occurrence, driving significant improvements in efficiency, profitability, and customer satisfaction.
Measuring and Sustaining CoPQ Improvements
The journey of CoPQ reduction is not complete without robust mechanisms for measuring progress and sustaining the gains achieved. Implementing reduction programs without clear metrics is akin to sailing without a compass; you might be moving, but you won’t know if you’re heading in the right direction or how far you’ve come. Effective measurement and sustainment strategies ensure that improvements are not temporary fixes but rather embedded into the organization’s operational DNA.
1. Establishing Key Performance Indicators (KPIs):
- Baseline Measurement: Before implementing any reduction program, it is crucial to establish a clear baseline CoPQ. This initial calculation serves as the benchmark against which all future improvements will be measured.
- Direct CoPQ Metrics: Track the total CoPQ as a percentage of sales, total manufacturing costs, or revenue. Monitor the breakdown of CoPQ into prevention, appraisal, internal failure, and external failure costs to identify shifts and ensure investments in prevention are paying off.
- Operational Quality Metrics:
- First Pass Yield (FPY): The percentage of products that pass inspection the first time without rework. An increase in FPY directly correlates to reduced internal failure costs.
- Defects Per Million Opportunities (DPMO): A Six Sigma metric indicating the number of defects per million units or opportunities for defects. A lower DPMO signifies higher quality and reduced CoPQ.
- Scrap Rate: Percentage of raw materials or finished goods discarded due to defects.
- Rework Rate: Percentage of products requiring additional work to meet specifications.
- On-Time Delivery (OTD) in Full: While not a direct CoPQ metric, it is often impacted by quality issues that cause delays or incomplete orders, leading to external failure costs.
- Customer-Centric Metrics:
- Customer Return Rate: Percentage of products returned by customers due to defects.
- Warranty Claim Costs: Total expenditure on warranty repairs, replacements, and associated logistics.
- Customer Complaint Volume: Number of complaints received related to product quality.
- Net Promoter Score (NPS) / Customer Satisfaction Scores: Indirectly reflects customer perception of quality.
2. Regular Reporting and Review Mechanisms:
- Dashboards and Scorecards: Develop visual dashboards that present CoPQ and related KPIs in an easily digestible format. These should be accessible to relevant stakeholders, from shop floor operators to senior management.
- Management Review Meetings: Conduct periodic (e.g., monthly or quarterly) meetings where CoPQ performance is reviewed. Discuss trends, identify new areas of concern, and evaluate the effectiveness of ongoing reduction programs.
- Financial Integration: Ensure CoPQ metrics are integrated into financial reporting, demonstrating the direct monetary impact of quality initiatives to the executive team. This helps secure continued investment and buy-in.
3. Sustaining Gains and Fostering a Culture of Quality:
- Standardization: Document and institutionalize improved processes through Standard Operating Procedures (SOPs), work instructions, and process control plans. This prevents regression to old, less effective methods.
- Auditing and Compliance: Conduct regular internal and external audits to ensure adherence to established quality standards and procedures. This helps identify any deviations early.
- Continuous Training and Development: Regularly train employees on new processes, quality tools, and technologies. Reinforce the importance of quality and empower them to identify and report issues.
- Knowledge Management: Capture lessons learned from CoPQ reduction projects and make them accessible across the organization. This prevents repeating past mistakes and accelerates future improvements.
- Recognition and Rewards: Acknowledge and reward individuals and teams for their contributions to quality improvement. This fosters a positive quality culture and motivates continued engagement.
- Leadership Commitment: Sustained CoPQ reduction requires unwavering commitment from top leadership. They must champion quality initiatives, allocate necessary resources, and communicate the strategic importance of quality throughout the organization.
By diligently measuring CoPQ, transparently reporting progress, and embedding quality into the organizational culture, manufacturers can ensure that their investments in CoPQ reduction programs yield lasting benefits, leading to enhanced competitiveness and long-term profitability.
Case Studies and Best Practices in CoPQ Management
The theoretical understanding of CoPQ comes to life through practical application and the lessons learned from successful implementations. Across various manufacturing sectors, companies that have embraced systematic CoPQ calculation and reduction programs have realized significant financial savings, operational efficiencies, and enhanced market standing. While specific company names may not always be public, generalized industry examples illustrate powerful best practices.
Case Study 1: Automotive Component Manufacturer – Reducing Internal Failure Costs
A mid-sized automotive component manufacturer faced persistent issues with high scrap and rework rates for a critical engine part, contributing significantly to their internal failure costs. Initial CoPQ calculation revealed these costs amounted to 8% of their manufacturing revenue. A Six Sigma DMAIC project was initiated. During the ‘Measure’ phase, detailed data from their MES showed specific machines and shifts had higher defect rates. ‘Analyze’ phase utilized fishbone diagrams and statistical analysis, pinpointing inconsistent material feeding mechanisms and inadequate operator training as root causes. In the ‘Improve’ phase, the company invested in automated material handling systems (Poka-Yoke) and comprehensive training programs for operators, emphasizing new SOPs. The ‘Control’ phase involved implementing real-time SPC charts on the MES to monitor key process parameters and regular audits. Within 12 months, the scrap rate was reduced by 60%, and rework by 45%, translating to a 3.5% reduction in CoPQ as a percentage of revenue, freeing up capital for further innovation and expansion.
Case Study 2: Electronics Manufacturer – Tackling External Failure Costs
An electronics company producing consumer gadgets struggled with high warranty claims and customer returns, indicative of substantial external failure costs. Their CoPQ calculation revealed these external costs were disproportionately high, impacting brand reputation. The company adopted a Design for Quality (DfQ) approach, leveraging advanced simulation tools during product development. They also enhanced their supplier quality management program, implementing stricter incoming material inspections and collaborative quality agreements with key component suppliers. Furthermore, they integrated an advanced QMS that centralized customer feedback, allowing for faster root cause analysis of field failures. By systematically addressing design flaws and improving supplier quality, they reduced warranty claims by 30% and customer returns by 25% within two years, significantly boosting customer satisfaction scores and brand loyalty. This proactive investment in prevention and appraisal drastically cut external failure costs, proving that investing upstream prevents costly downstream issues.
Case Study 3: Industrial Machinery Producer – Optimizing Prevention Costs
An industrial machinery manufacturer recognized that while their external failure costs were relatively low, their appraisal costs were excessively high due to extensive final product testing and multiple in-process inspections. Their CoPQ analysis showed a large imbalance, with appraisal costs overshadowing prevention. They decided to shift their focus towards prevention. They invested in advanced IoT sensors on their assembly lines to monitor process parameters in real-time, enabling predictive maintenance and early anomaly detection. They also implemented a comprehensive employee empowerment program, training operators to perform basic quality checks and stop the line if issues arose (Jidoka). This strategic shift allowed them to reduce reliance on end-of-line inspections, cutting appraisal costs by 20% while simultaneously improving first-pass yield and reducing internal failures. The initial investment in technology and training paid dividends by optimizing their prevention efforts and reducing overall CoPQ.
Best Practices for CoPQ Management:
- Start Small, Think Big: Begin with a pilot project on a specific product line or process where CoPQ is visibly high. Document successes and use them to build momentum for broader implementation.
- Secure Leadership Buy-in: CoPQ reduction requires resources and cross-functional cooperation. Strong leadership commitment is essential for driving change and overcoming resistance.
- Cross-Functional Teams: Form teams comprising members from quality, operations, engineering, and finance to ensure a holistic approach to data collection, analysis, and solution implementation.
- Data-Driven Decisions: Base all CoPQ reduction efforts on accurate data. Avoid assumptions and emotional responses. Utilize statistical tools for root cause analysis and impact assessment.
- Focus on Prevention: While addressing immediate failures is necessary, the long-term goal should always be to shift spending from appraisal and failure costs to prevention. This yields the highest ROI.
- Continuous Improvement Culture: Embed CoPQ management into the organizational culture. Encourage all employees to identify opportunities for improvement and provide them with the tools and training to act on them.
- Leverage Technology: Utilize QMS, MES, ERP, IIoT, and AI/ML to enhance data collection, analysis, prediction, and automation, making CoPQ management more efficient and effective.
These examples and best practices underscore that systematic CoPQ calculation and reduction programs are not just about cutting costs; they are strategic investments that lead to higher quality products, more satisfied customers, and a more resilient, profitable manufacturing operation.
Comparison Table: Methods, Tools, and Systems for CoPQ Management
Effective Cost of Poor Quality (CoPQ) management relies on a combination of strategic methodologies, robust quality tools, and integrated technological systems. The table below compares several key approaches and platforms, highlighting their primary features, benefits, and optimal use cases for manufacturers aiming to calculate and reduce CoPQ.
| Method/Tool/System | Key Features | Primary Benefit for CoPQ | Best Use Case |
|---|---|---|---|
| PAF Model (Prevention, Appraisal, Failure) | Categorizes costs into four buckets: Prevention, Appraisal, Internal Failure, External Failure. Provides a structured framework for cost identification. | Provides a clear, categorized view of all quality-related costs, serving as a baseline for analysis and improvement. | Initial CoPQ assessment, regular financial reporting of quality costs, and strategic planning for resource allocation. |
| Lean Manufacturing | Focus on waste elimination (Muda), value stream mapping, JIT, Poka-Yoke, Kaizen. | Reduces internal failure costs by eliminating non-value-added activities, improving process flow, and preventing defects. | Process optimization, reducing rework/scrap, improving efficiency, fostering continuous improvement culture. |
| Six Sigma (DMAIC) | Data-driven methodology for defect reduction and process variation control (Define, Measure, Analyze, Improve, Control). | Systematic problem-solving to identify and eliminate root causes of defects, leading to significant CoPQ reduction. | Addressing complex, recurring quality issues; achieving high-level process consistency and reliability. |
| Quality Management Systems (QMS) Software |